Rental Search Patterns Offer a Window Into Where Relocation Demand May Be Heading
- Outside interest is growing fastest in Buffalo, Chicago and Houston, where out-of-town rental search shares grew the most year over year.
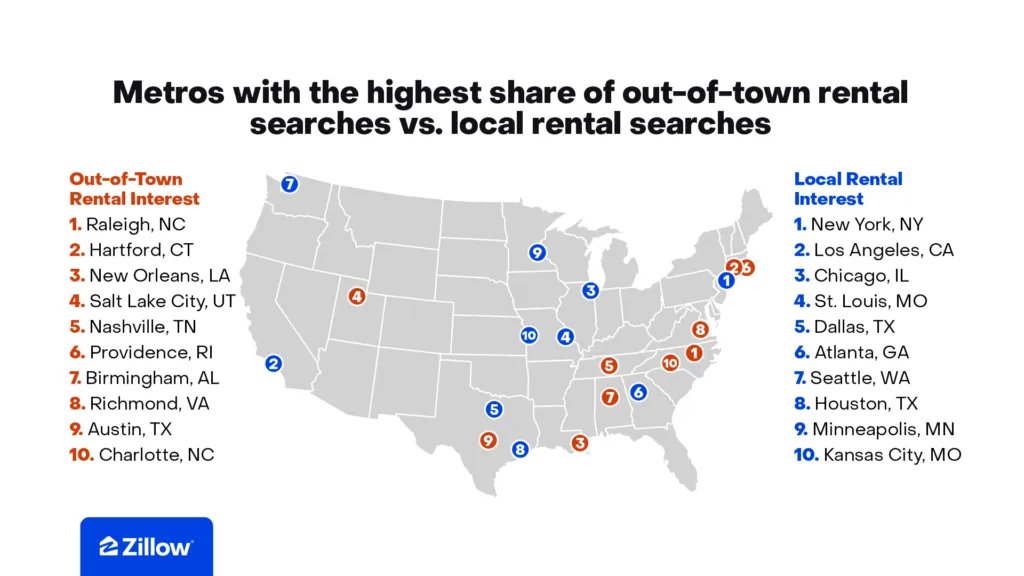
- In established hotspots — Raleigh (59%), Hartford (55%), New Orleans (54%) and Nashville (52%) — outside rental searchers outnumber local rental searchers on Zillow.
- The largest shares of long-distance rental searches typically come from neighboring states. The notable exception is New Yorkers looking south, especially in Florida.
Prospective renters are looking beyond their own backyards, and new Zillow® data reveals where they’re setting their sights. An analysis of rental listing page views found that out-of-town interest is growing fastest in Buffalo, Chicago and Houston. The share of searches coming from renters outside these markets has surged over the past year — an early signal of where relocation demand may be heading next.
Rental search patterns are an early signal of migration trends — when outside search share grows in a market, it often points to a developing pipeline of incoming renters. The year-over-year surge in out-of-town browsing in markets like Buffalo and Chicago may suggest a wave of newcomers is not far behind.
Outside vs. local: Where rental interest is shifting year over year
Buffalo saw the steepest climb in outside interest over the past year, with its out-of-town rental share growing 4.2 percentage points. Chicago (up 3.7 percentage points), Houston (+3.4), New Orleans (+3.2) and Dallas (+3) saw the next biggest gains.
Meanwhile, Cincinnati led local share growth, up 8.1 percentage points year over year, followed by Jacksonville (+4.6) and Columbus (+3.2), a likely sign that homegrown demand is driving these rental markets.
The markets drawing the most out-of-town rental searches
The markets drawing the most out-of-town rental interest are concentrated in the Sun Belt and Mid-Atlantic. These markets have absorbed years of relocation demand from higher-cost coastal metros.
Raleigh tops the list with 59% of page views on rental listings coming from outside the metro area. Hartford (55.1%), New Orleans (53.7%), Salt Lake City (51.9%) and Nashville (51.7%) round out the top five. Providence, named Zillow’s hottest rental market of 2026, is next with 51.5% of rental page views coming from out-of-towners.
At the other end of the spectrum, New York (76.3% of page views on rental listings coming from locals), Los Angeles (72.9%) and Chicago (69.1%) are the most locally driven markets.
As the three biggest markets in the U.S., their population sizes are a primary reason the most local rental traffic is seen in these areas — there are simply more potential rental shoppers. Metros that outperform their population include St. Louis, which ranks No. 4 among major markets with 67.2% of rental page views coming from within the metro; Kansas City, which ranks No. 10 at 63.3%; and Las Vegas, which ranks No. 13 at 62.1%.

Top cross-metro shopping flows
Most cross-market rental searches happen between neighboring metros. Washington, D.C. rental searchers account for 23.9% of all rental page views on Baltimore listings. Similar short-distance flows dominate the top of the list, with Los Angeles renters browsing Riverside (21.3%), San Francisco renters browsing San Jose (17.6%) and Boston renters browsing Providence (16.1%).
When looking only at long-distance searches — between markets in different states and at least 100 miles apart — the most common flow is renters in the New York area browsing listings in Hartford, accounting for 6% of all Hartford rental page views on Zillow. Other common flows include Los Angeles renters browsing Las Vegas listings (5.5% of all Las Vegas rental page views), Houston renters browsing Oklahoma City (5.2%) and Boston renters browsing Buffalo (5%).
Among the 20 most common long-distance searches, most occur within neighboring states. The notable exception is New Yorkers looking south. Rental shoppers in the New York metro area make up 2.8% of all page views in Raleigh, about 425 miles and several states away. They also account for large shares of views in Miami (4.8%), Orlando (2.7%) and Tampa (2.4%).
| Metro Area | Share of Rental Page Views From Out-of-Towners | Year over Year Change: Out-of-Town Rental Page View Share (Percentage Points) | Out-of-Town Market With the Highest Share of Rental Page Views | Share of Rental Page Views Coming From Top Out-of-Town Market |
| Raleigh, NC | 59.0% | -0.8 | Charlotte, NC | 5.4% |
| Hartford, CT | 55.1% | -1.9 | New York, NY | 6.0% |
| New Orleans, LA | 53.7% | +3.2 | Houston, TX | 1.9% |
| Salt Lake City, UT | 51.9% | +0.3 | Los Angeles, CA | 2.1% |
| Nashville, TN | 51.7% | +0.5 | Memphis, TN | 1.7% |
| Providence, RI | 51.5% | -0.7 | Boston, MA | 16.1% |
| Birmingham, AL | 50.0% | -1.8 | Atlanta, GA | 4.0% |
| Richmond, VA | 50.0% | -0.9 | Virginia Beach, VA | 14.1% |
| Austin, TX | 49.5% | +1.9 | San Antonio, TX | 5.3% |
| Charlotte, NC | 49.2% | -1.2 | New York, NY | 2.4% |
| Baltimore, MD | 48.4% | -0.4 | Washington, DC | 23.9% |
| Jacksonville, FL | 48.2% | -4.6 | Orlando, FL | 3.6% |
| Oklahoma City, OK | 47.8% | +0.9 | Houston, TX | 5.2% |
| San Antonio, TX | 47.5% | +0.5 | Austin, TX | 5.7% |
| San Jose, CA | 47.2% | -2.4 | San Francisco, CA | 17.6% |
| Tampa, FL | 46.4% | +2.7 | Miami, FL | 5.9% |
| Sacramento, CA | 46.1% | -2.1 | San Francisco, CA | 5.1% |
| San Francisco, CA | 45.0% | 0.0 | San Jose, CA | 11.7% |
| Orlando, FL | 44.8% | +0.6 | Miami, FL | 5.3% |
| Riverside, CA | 44.2% | +0.5 | Los Angeles, CA | 21.3% |
| Memphis, TN | 43.9% | +1.7 | Nashville, TN | 3.5% |
| Virginia Beach, VA | 43.9% | 0.0 | Richmond, VA | 7.9% |
| Louisville, KY | 42.6% | -0.7 | Indianapolis, IN | 4.3% |
| Cleveland, OH | 42.4% | +1.2 | Columbus, OH | 5.6% |
| Indianapolis, IN | 42.4% | -1.0 | Chicago, IL | 4.1% |
| Milwaukee, WI | 42.4% | -2.4 | Chicago, IL | 7.8% |
| Portland, OR | 42.3% | -0.5 | Seattle, WA | 3.2% |
| Boston, MA | 42.2% | -0.6 | New York, NY | 4.3% |
| Pittsburgh, PA | 42.0% | +2.0 | New York, NY | 2.6% |
| Columbus, OH | 40.8% | -3.2 | Cincinnati, OH | 4.5% |
| San Diego, CA | 40.0% | -0.9 | Los Angeles, CA | 8.8% |
| Buffalo, NY | 39.9% | +4.2 | Boston, MA | 5.0% |
| Cincinnati, OH | 39.9% | -8.1 | Columbus, OH | 5.4% |
| Washington, DC | 39.6% | -0.1 | Baltimore, MD | 7.7% |
| Denver, CO | 39.3% | -1.0 | Dallas, TX | 1.0% |
| Philadelphia, PA | 39.1% | +0.6 | New York, NY | 7.3% |
| Phoenix, AZ | 38.1% | +0.7 | Los Angeles, CA | 2.3% |
| Las Vegas, NV | 37.9% | +1.8 | Los Angeles, CA | 5.4% |
| Miami, FL | 37.0% | +2.2 | New York, NY | 4.8% |
| Detroit, MI | 36.8% | -1.5 | Chicago, IL | 1.4% |
| Kansas City, MO | 36.7% | -1.7 | Denver, CO | 1.8% |
| Minneapolis, MN | 35.8% | +2.9 | Chicago, IL | 2.0% |
| Houston, TX | 35.2% | +3.4 | Dallas, TX | 3.0% |
| Seattle, WA | 35.1% | -0.5 | Portland, OR | 1.5% |
| Atlanta, GA | 34.3% | -0.4 | New York, NY | 1.7% |
| Dallas, TX | 33.7% | +3.0 | Houston, TX | 1.6% |
| St. Louis, MO | 32.8% | +1.8 | Chicago, IL | 2.4% |
| Chicago, IL | 30.9% | +3.7 | Milwaukee, WI | 1.4% |
| Los Angeles, CA | 27.1% | +0.8 | Riverside, CA | 5.2% |
| New York, NY | 23.7% | -0.5 | Philadelphia, PA | 1.6% |
The post Rental Search Patterns Offer a Window Into Where Relocation Demand May Be Heading appeared first on Zillow Research.