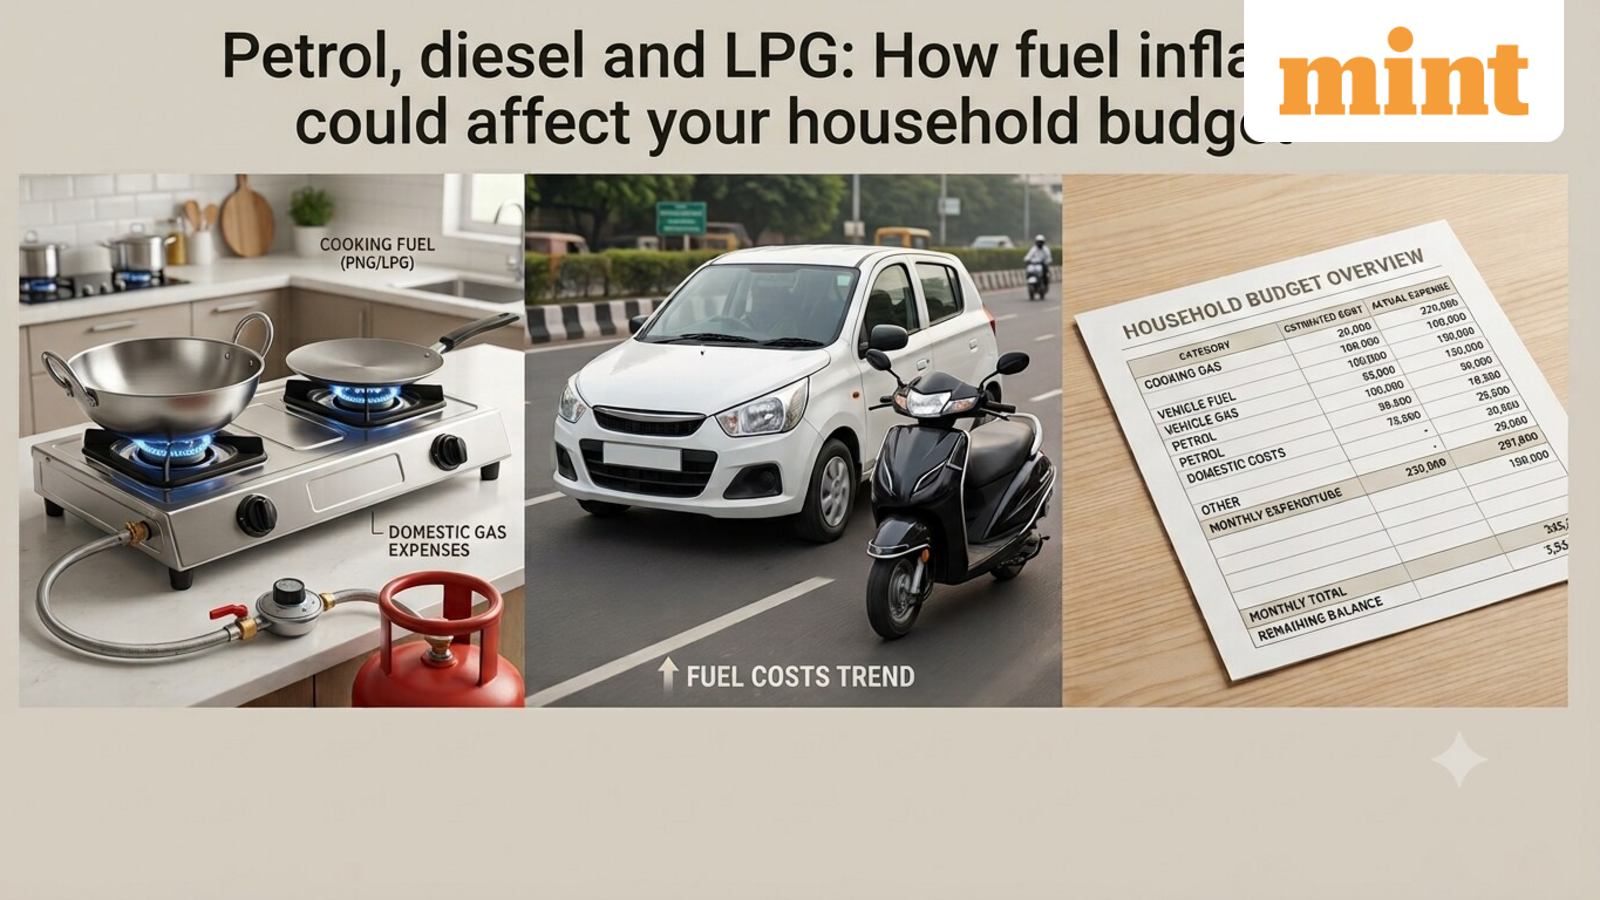
Fuel inflation explained: How changes in petrol, CNG, LPG and PNG prices could affect your household budget
Fuel costs can have a direct bearing on a household’s monthly budget, from cooking gas and PNG to petrol, diesel and CNG used for commuting.
The Ministry of Finance’s Monthly Economic Review for September 2026 highlights how inflation across these fuel categories changed in June, July and August. Here’s what the latest figures mean for household expenses.
What does CPI Inflation show?
The Consumer Price Index (CPI) measures changes in the prices of goods and services that households regularly buy, including food, clothing, fuel, and transport.
Year-on-year (Y-o-Y) inflation shows how prices in a particular month compare with the same month a year earlier.
| CPI Inflation (YoY) | Jun-26 (%) | Jul-26 (%) | Aug-26 (%) |
| LPG cylinder and piped natural gas | 4.6 | 4.99 | 5.28 |
| Coal | 8.79 | 8.13 | 8.06 |
| Firewood and chips | 7.41 | 7.94 | 8.26 |
*Source: Ministry of Finance September 2026 report; For household fuel
What does this mean for your household fuel bill?
LPG and piped natural gas inflation rose from 4.60% in June 2026 to 5.28% in August 2026. This means households using these fuels were paying more, compared with the same period a year earlier.
For example, if an LPG cylinder costs ₹1,000 in August 2026, a 5.28% Y-o-Y inflation rate implies that the comparable price a year earlier was around ₹950. The increase is therefore about ₹50 per cylinder.
However, coal and firewood inflation was higher than LPG inflation in August, at 8.06% and 8.26%, respectively.
Who faces a higher impact from transport fuel inflation?
| CPI Inflation (YoY) | Jun-26 (%) | Jul-26 (%) | Aug-26 (%) |
| Diesel | 8.40 | 8.40 | 8.40 |
| Petrol | 7.51 | 7.50 | 7.51 |
| Other natural gas (CNG) | 6.20 | 6.23 | 8.16 |
*Source: Ministry of Finance September 2026 report; For transport fuel
Transport fuel inflation affects households both directly and indirectly. People who use cars or two-wheelers could face a direct impact through higher fuel expenses.
For example, if a person spends ₹5,000 a month on petrol, a 7.51% Y-o-Y increase would indicate that the comparable expense was about ₹4,650 a year earlier, assuming the same quantity of fuel was purchased.
CNG inflation rose sharply to 8.16% in August from 6.23% in July, potentially increasing fuel costs for people using CNG vehicles. However, diesel and petrol inflation remained largely unchanged.
Transport fuel costs can also feed into other household expenses because fuel is an input for transportation of goods and services. This means households that do not own a vehicle may still feel an indirect impact through commuting, delivery charges, or the prices of some goods and services.
How should households read these inflation numbers?
For example, consider a three-member household where the mother uses PNG for cooking, the father drives a CNG car, and the child uses a petrol scooter. Suppose the household spent ₹1,500 on PNG, ₹6,000 on CNG, and ₹3,000 on petrol in August 2025.
Using the August 2026 inflation rates, a 5.28% rise in piped natural gas prices would put the comparable PNG expense at about ₹1,579. Similarly, an 8.16% rise in CNG prices would take the expense to about ₹6,490, while a 7.51% rise in petrol prices would increase the petrol expense to about ₹3,225.
This would mean a combined monthly fuel expense of around ₹11,294 in August 2026, compared with ₹10,500 in August 2025 — an increase of about ₹794, assuming the household consumed the same quantity of each fuel in both months.
The actual increase in a household’s spending would depend on changes in fuel consumption, tariffs, retail prices, and usage patterns.
Disclaimer: This is purely for educational/informational purposes and should not be taken as any sort of advice. All examples are hypothetical.