Must-read for homebuyers: Planning to buy a new house from a developer? Here’s what you should consider
If you are planning to buy a home from a developer, the latest housing data points to an important shift. Home prices are still holding up, but the market is no longer seeing the rapid price-led growth of the past few years. Sales volumes have softened, while developers have increased new supply.
According to the India Housing Report – September 2026 by the National Association of Realtors-India and CRE Matrix, primary housing sales across Tier-1 cities were worth ₹3.63 lakh crore in H1 2026 (January-June), almost unchanged from ₹3.65 lakh crore in H1 2025.
But the number of homes sold fell 2% to 2.58 lakh units. Here, units sold means the number of residential housing units (homes) sold directly by developers.
Does this mean home prices are rising?
The average ticket size — the average value of a home sold, calculated by dividing total sales value by the number of homes sold — rose only 2% to ₹1.41 crore from ₹1.38 crore.
For buyers, this suggests that the rapid rise in the average value of homes seen in previous years is beginning to moderate. It does not mean every property has become cheaper.
Prices can vary substantially depending on the city, locality, project, and size of the home.
Are buyers getting more choices?
Yes. Developers launched 2.98 lakh housing units in H1 2026, up 7% from H1 2025 and 18% from H2 2025. Launches refer to new housing units introduced for sale during the period.
For buyers, higher launches mean more projects and properties to compare. But supply has increased faster than sales, so buyers should compare prices, specifications, location, and the developer’s track record rather than assume that new supply automatically means lower prices.
Which cities are seeing the biggest changes?
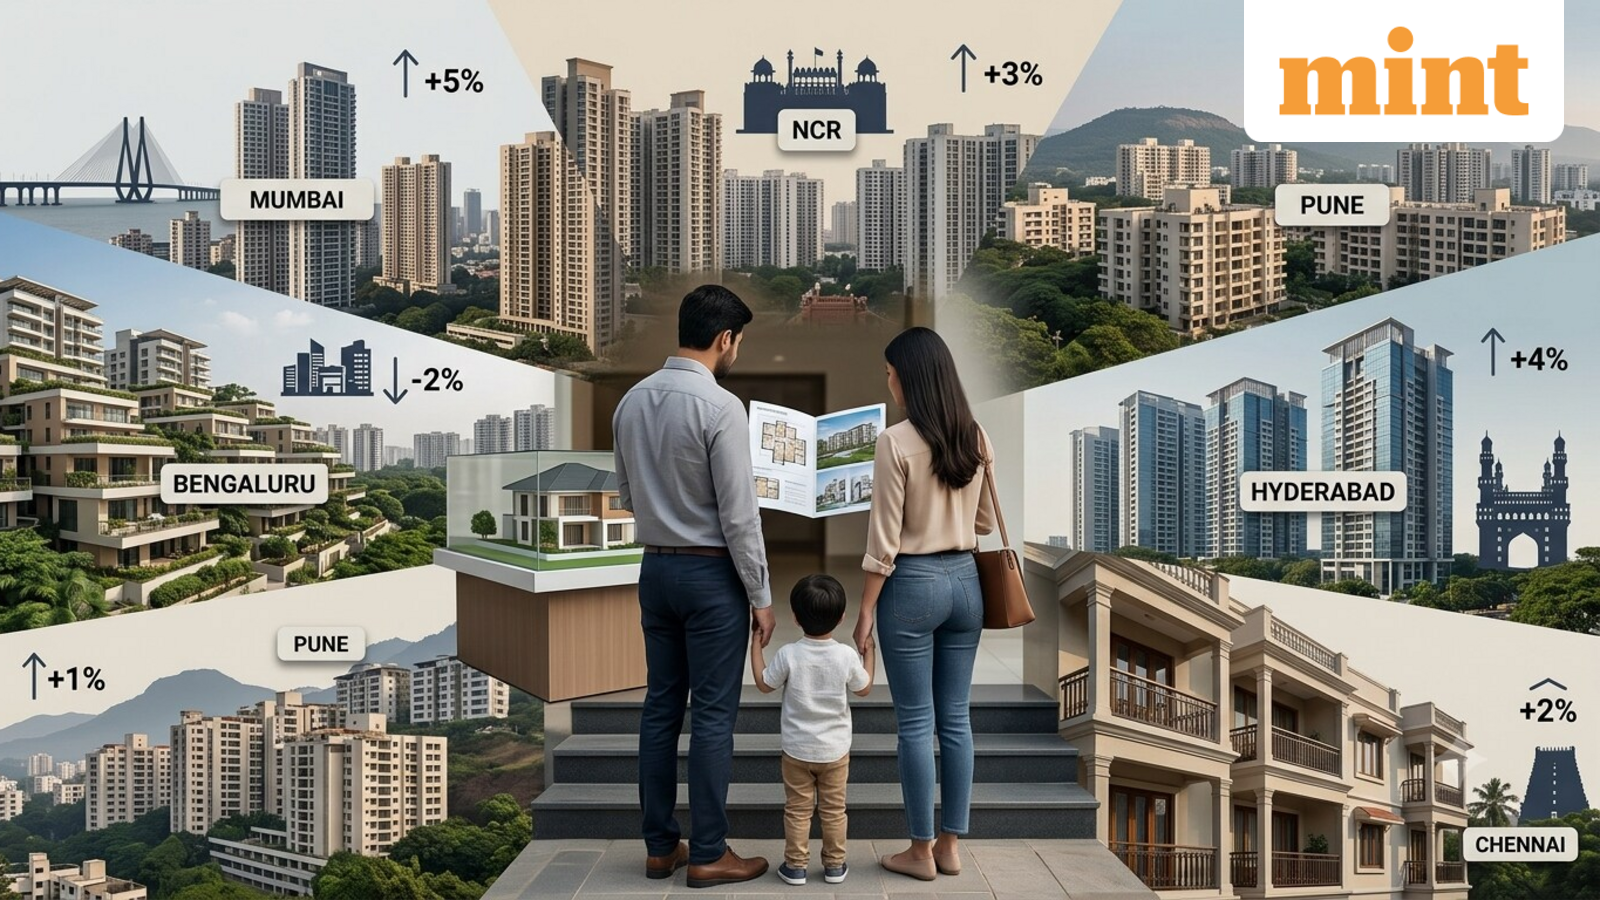
The numbers vary sharply across major housing markets in H1 2026 (January-June 2026), compared with H1 2025.
Among the broad regions, MMR recorded the highest sales value and the highest number of homes sold at ₹93,757 crore and 83,613 units, respectively. Its average ticket size was ₹1.12 crore.
At the other end, NCR recorded ₹68,217 crore in sales and 24,630 units sold, while its average ticket size was much higher at ₹2.77 crore. This shows that a higher sales value does not necessarily mean more homes are being sold. The value also depends on the type and price of homes buyers are purchasing.
Among individual cities and sub-markets, Mumbai had the highest sales value at ₹58,362 crore, while Pune recorded the highest number of homes sold at 43,347 units.
Gurugram had the highest average ticket size at ₹3.15 crore, followed by Noida at ₹2.78 crore. Thane + Palghar had the lowest average ticket size at ₹55 lakh, followed by Navi Mumbai + Raigad at ₹71 lakh.
The table also shows how differently prices and demand are moving. For example, Pune sold fewer homes but recorded higher sales value because its average ticket size increased 9%. In Chennai, sales value rose 16% even as units sold fell 12%, with the average ticket size jumping 32%.
| Market | Sales value H1’26 | Change | Units sold | Change | Avg. ticket size | Change |
| MMR | ₹93,757 cr | +8% | 83,613 | +9% | ₹1.12 cr | Flat |
| Mumbai | ₹58,362 cr | +4% | 24,524 | Flat | ₹2.38 cr | +4% |
| Thane + Palghar | ₹23,052 cr | +10% | 41,740 | +10% | ₹55 lakh | Flat |
| Navi Mumbai + Raigad | ₹12,292 cr | +29% | 17,316 | +20% | ₹71 lakh | +8% |
| Pune | ₹36,025 cr | +4% | 43,347 | -5% | ₹83 lakh | +9% |
| NCR | ₹68,217 cr | -24% | 24,630 | -9% | ₹2.77 cr | -16% |
| Gurugram | ₹37,726 cr | -33% | 11,972 | Flat | ₹3.15 cr | -32% |
| Noida | ₹21,918 cr | +7% | 7,877 | -7% | ₹2.78 cr | +15% |
| Hyderabad | ₹56,966 cr | +1% | 28,190 | -11% | ₹2.02 cr | +13% |
| Bengaluru | ₹60,875 cr | +25% | 34,554 | +7% | ₹1.76 cr | +17% |
| Ahmedabad | ₹24,876 cr | -9% | 22,967 | -13% | ₹1.08 cr | +4% |
| Chennai | ₹13,722 cr | +16% | 10,456 | -12% | ₹1.31 cr | +32% |
| Kolkata | ₹9,046 cr | -3% | 9,862 | -12% | ₹92 lakh | +11% |
Source: National Association of Realtors-India (NAR-India) and CRE Matrix, India Housing Report – September 2026. The table compares key housing markets in H1 2026 with H1 2025 based on sales value, units sold (number of homes sold) and average ticket size.
What should a homebuyer take from this?
For buyers, that makes comparison more important than timing the entire housing market.
Check the price of similar properties nearby, compare newly launched and ready-to-move-in projects, examine the developer’s track record and possession timeline, and calculate the total cost, including registration, maintenance, and financing, before deciding.
Disclaimer: This is only for informational and educational purposes. Please consult a qualified expert before making any financial decisions.