U.S. Home Prices Rose 0.25% in August
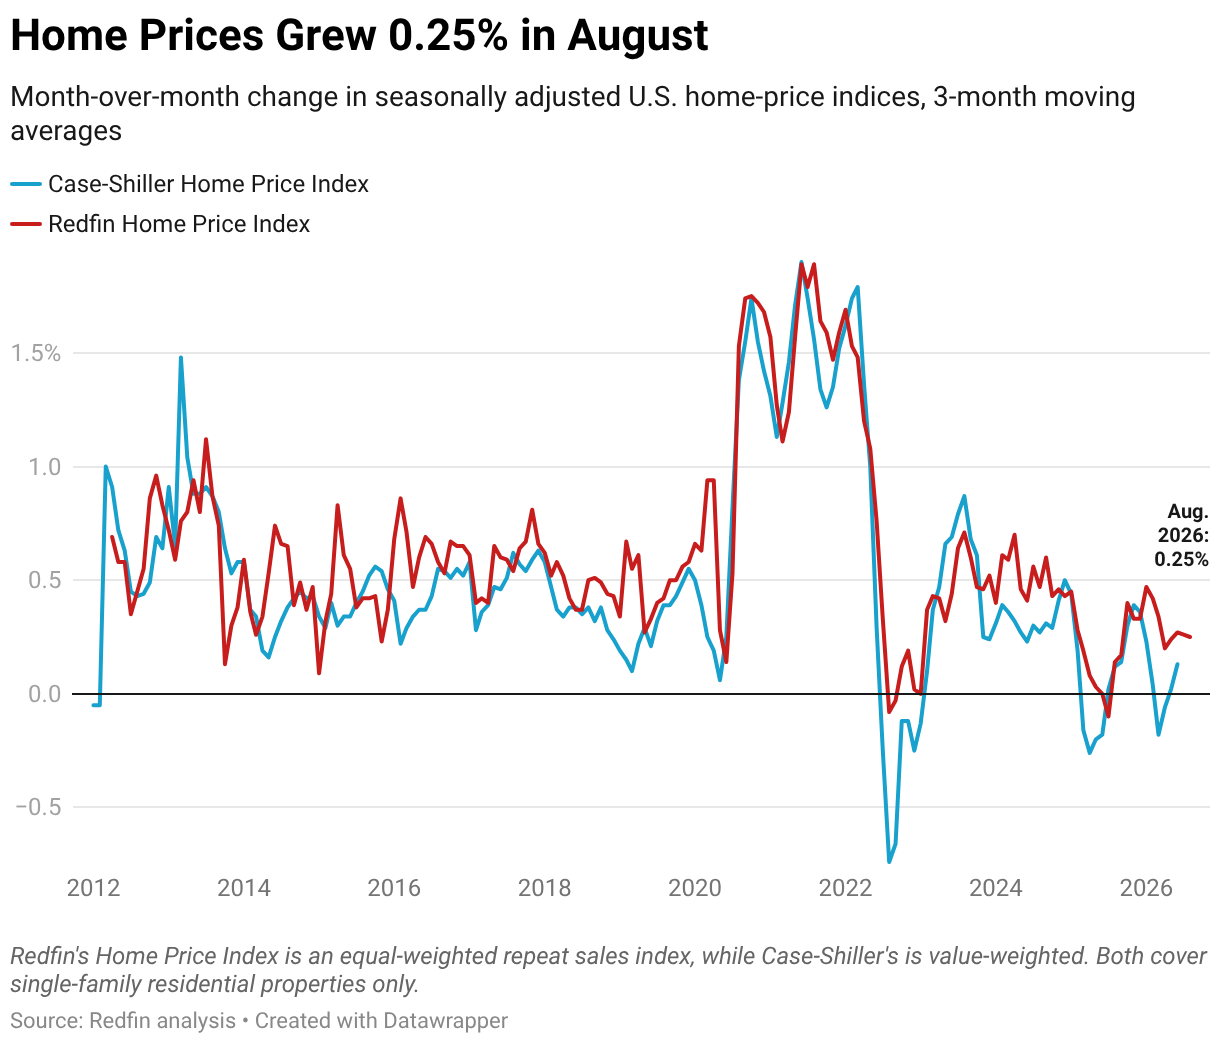
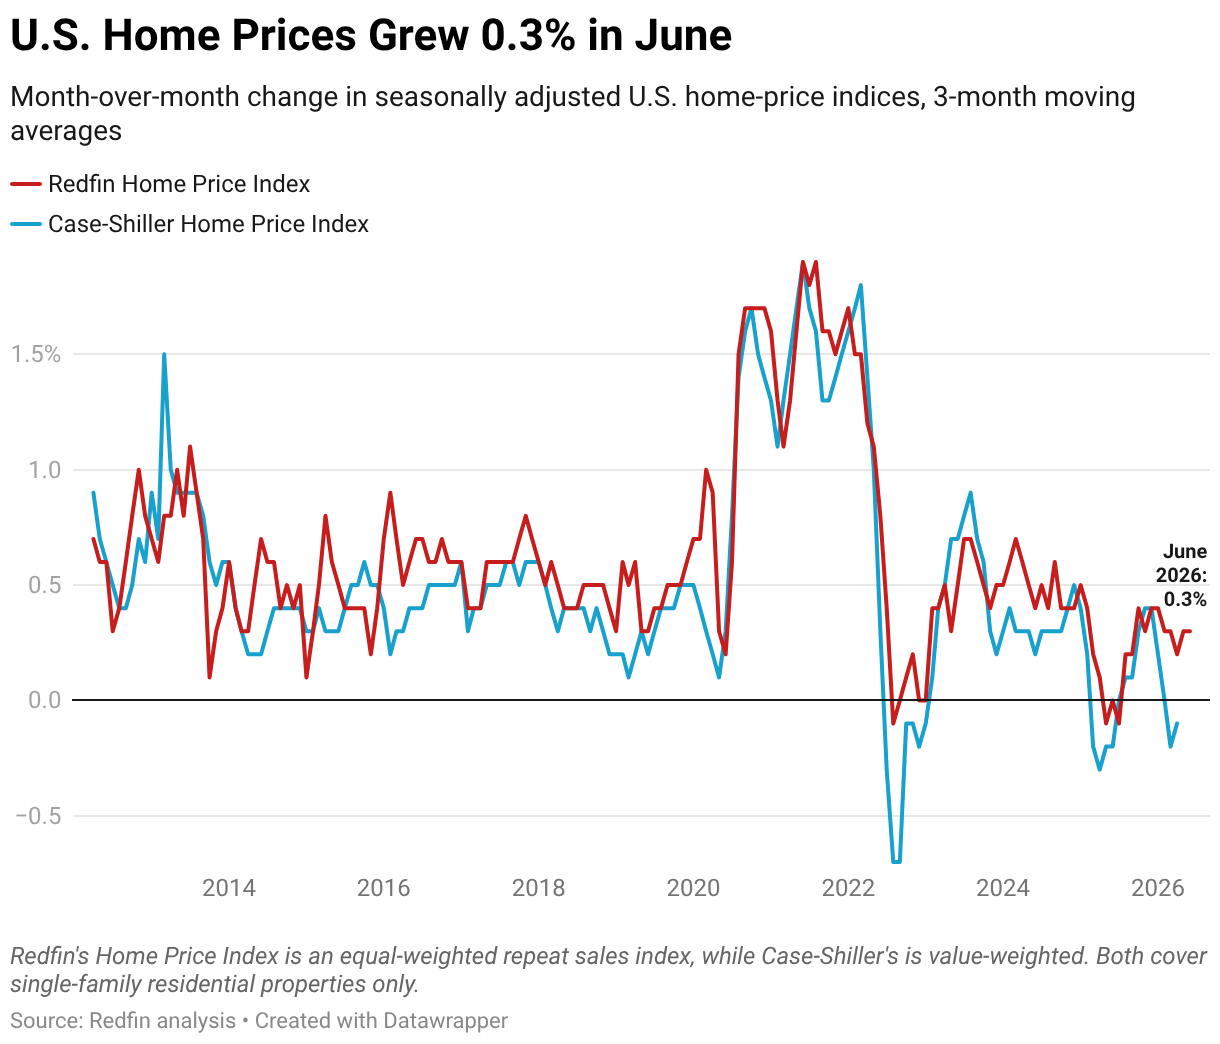
- Nationwide, home prices grew 0.25% in August, down marginally from 0.26% in July and 0.27% in June.
- St. Louis and Pittsburgh had the fastest month-over-month price growth in August.
- Prices declined most in Austin and Charlotte, both of which have significantly more sellers than buyers in the market.
U.S. home prices increased 0.25% month over month in August on a seasonally adjusted basis. That’s down just slightly from 0.26% the previous month and 0.27% the month before that.
Prices rose 3.7% from a year earlier in August, the fastest annual growth rate in a year.
This is according to the Redfin Home Price Index (RHPI), which uses the repeat-sales pricing method to calculate seasonally adjusted changes in single-family home prices. The RHPI measures how sale prices of homes have changed since their previous sale—similar to the S&P Cotality Case-Shiller Home Price Indices—but is reported about a month earlier. August data covers the three months ending August 31, 2026. Read the full RHPI methodology here.
Price growth lost a tiny bit of steam because buyers gained even more bargaining power than they already had: August was the strongest buyer’s market on record, with 58% more home sellers than buyers in the U.S. In many parts of the Sun Belt, there were over 100% more sellers than buyers. Demand remains sluggish due to elevated housing costs and economic uncertainty, and at the same time, the number of homes for sale keeps climbing.
Still, sale prices continue to rise, partly because many homeowners have substantial equity and little incentive to accept a steep discount if they put their home on the market. That puts a floor under home prices. The hot luxury segment, driven in part by affluent buyers in Florida and San Francisco’s AI-fueled housing market, is another factor keeping prices afloat.
“Slowing price growth is good news for buyers because it means waiting for the right home is less likely to come with a rapidly rising price tag,” said Chen Zhao, Redfin’s head of economics. “Buyers can afford to be choosy and negotiate. Sellers should recognize that pricing too high in today’s market could mean their home sits on the market–and they may eventually have to cut the price. Pricing realistically from the start is a good way to attract attention.”
One way to arrive at the right asking price is through Redfin Early Access, which allows sellers to test the market before officially listing their home.
Home Prices Are Rising Most in St. Louis, Falling Most in Texas
Home prices rose in roughly half of the 50 most populous U.S. metros month over month in August.
The biggest increase was in St. Louis, where home prices rose 1.1% month over month on a seasonally adjusted basis. It’s followed by Pittsburgh (1%), San Antonio (0.9%), San Jose, CA (0.9%) and Baltimore (0.9%). St. Louis’ relatively affordable prices are attracting buyers and propping up prices, and San Francisco’s hot market is likely spilling over into San Jose.
The biggest price declines were in Austin, TX (-0.7% month over month) and Charlotte, NC (-0.7%). Next come Milwaukee (-0.6%), Warren, MI (-0.6%) and Fort Lauderdale, FL (-0.5%).
On a year-over-year basis, prices rose most in San Francisco in August, with a 12% annual increase. Next come West Palm Beach, FL (10.4%), Chicago (9.2%), Nassau County, NY (8.1%) and Miami (8%). San Francisco and Nassau County are two of just five seller’s markets in the U.S., prompting bidding wars and pushing up prices.
Prices declined year over year in five major metros, four in Texas plus Seattle. Dallas (-1.4%) had the biggest drop, followed by Austin (-1%), Fort Worth (-0.7%), San Antonio (-0.4%) and Seattle (-0.1%). Prices are ticking down in those Texas metros because they are among the strongest buyer’s markets in the nation, with over twice as many sellers as buyers. Seattle is also a buyer’s market. In those places, sellers may need to lower prices to attract buyers.
For more on Redfin’s Home Price Index, please visit our Data Center.
| Metro-Level Summary: Redfin Home Price Index, August 2026
50 most populous U.S. metro areas |
||
| U.S. metro area | Month-over-month change, seasonally adjusted | Year-over-year change |
| Anaheim, CA | 0.1% | 5.6% |
| Atlanta, GA | 0.4% | 2.2% |
| Austin, TX | -0.7% | -1.1% |
| Baltimore, MD | 0.9% | 4.6% |
| Boston, MA | 0.0% | 2.8% |
| Charlotte, NC | -0.7% | 2.4% |
| Chicago, IL | 0.4% | 9.2% |
| Cincinnati, OH | 0.8% | 7.3% |
| Cleveland, OH | 0.0% | 7.5% |
| Columbus, OH | 0.3% | 5.3% |
| Dallas, TX | -0.2% | -1.4% |
| Denver, CO | 0.3% | 1.3% |
| Detroit, MI | -0.4% | 5.9% |
| Fort Lauderdale, FL | -0.5% | 1.8% |
| Fort Worth, TX | 0.0% | -0.7% |
| Houston, TX | -0.3% | 0.2% |
| Indianapolis, IN | 0.3% | 1.2% |
| Jacksonville, FL | 0.4% | 0.4% |
| Kansas City, MO | -0.4% | 3.3% |
| Las Vegas, NV | -0.5% | 1.0% |
| Los Angeles, CA | -0.3% | 4.3% |
| Miami, FL | 0.2% | 8.0% |
| Milwaukee, WI | -0.6% | 7.6% |
| Minneapolis, MN | 0.3% | 3.9% |
| Montgomery County, PA | 0.2% | 7.1% |
| Nashville, TN | -0.1% | 3.2% |
| Nassau County, NY | -0.5% | 8.1% |
| New Brunswick, NJ | -0.3% | 4.5% |
| New York, NY | 0.0% | 7.1% |
| Newark, NJ | -0.1% | 5.8% |
| Oakland, CA | 0.6% | 3.6% |
| Orlando, FL | 0.7% | 1.8% |
| Philadelphia, PA | 0.2% | 6.5% |
| Phoenix, AZ | 0.3% | 0.3% |
| Pittsburgh, PA | 1.0% | 5.7% |
| Portland, OR | 0.5% | 2.2% |
| Providence, RI | 0.1% | 6.5% |
| Riverside, CA | 0.7% | 2.3% |
| Sacramento, CA | 0.0% | 0.6% |
| San Antonio, TX | 0.9% | -0.4% |
| San Diego, CA | -0.2% | 3.2% |
| San Francisco, CA | 0.4% | 12.0% |
| San Jose, CA | 0.9% | 3.0% |
| Seattle, WA | 0.1% | -0.1% |
| St. Louis, MO | 1.1% | 4.5% |
| Tampa, FL | 0.0% | 4.1% |
| Virginia Beach, VA | 0.7% | 7.1% |
| Warren, MI | -0.6% | 2.8% |
| Washington, DC | -0.2% | 4.5% |
| West Palm Beach, FL | 0.7% | 10.4% |
The post U.S. Home Prices Rose 0.25% in August appeared first on Redfin Real Estate News.