U.S. Home Prices Rose 0.3% From a Month Earlier in June
-
- Home prices rose 0.3% in June, tied with May for the fastest growth since the start of 2026.
- Prices rose 3% on a year-over-year basis–the fastest growth rate in 10 months.
- Prices rose in 30 major metros month over month, with the biggest increases in Columbus (1.2%), Miami (1.1%) and Cincinnati (1%).
- This is based on the Redfin Home Price Index (RHPI), a repeat-sales measure of seasonally adjusted home-price changes that is reported about a month earlier than the Case-Shiller Index.
U.S. home prices increased 0.3% month over month in June on a seasonally adjusted basis. That’s tied with the month before for the fastest growth rate since January.
Prices rose 3% from a year earlier, the fastest annual growth in 10 months.
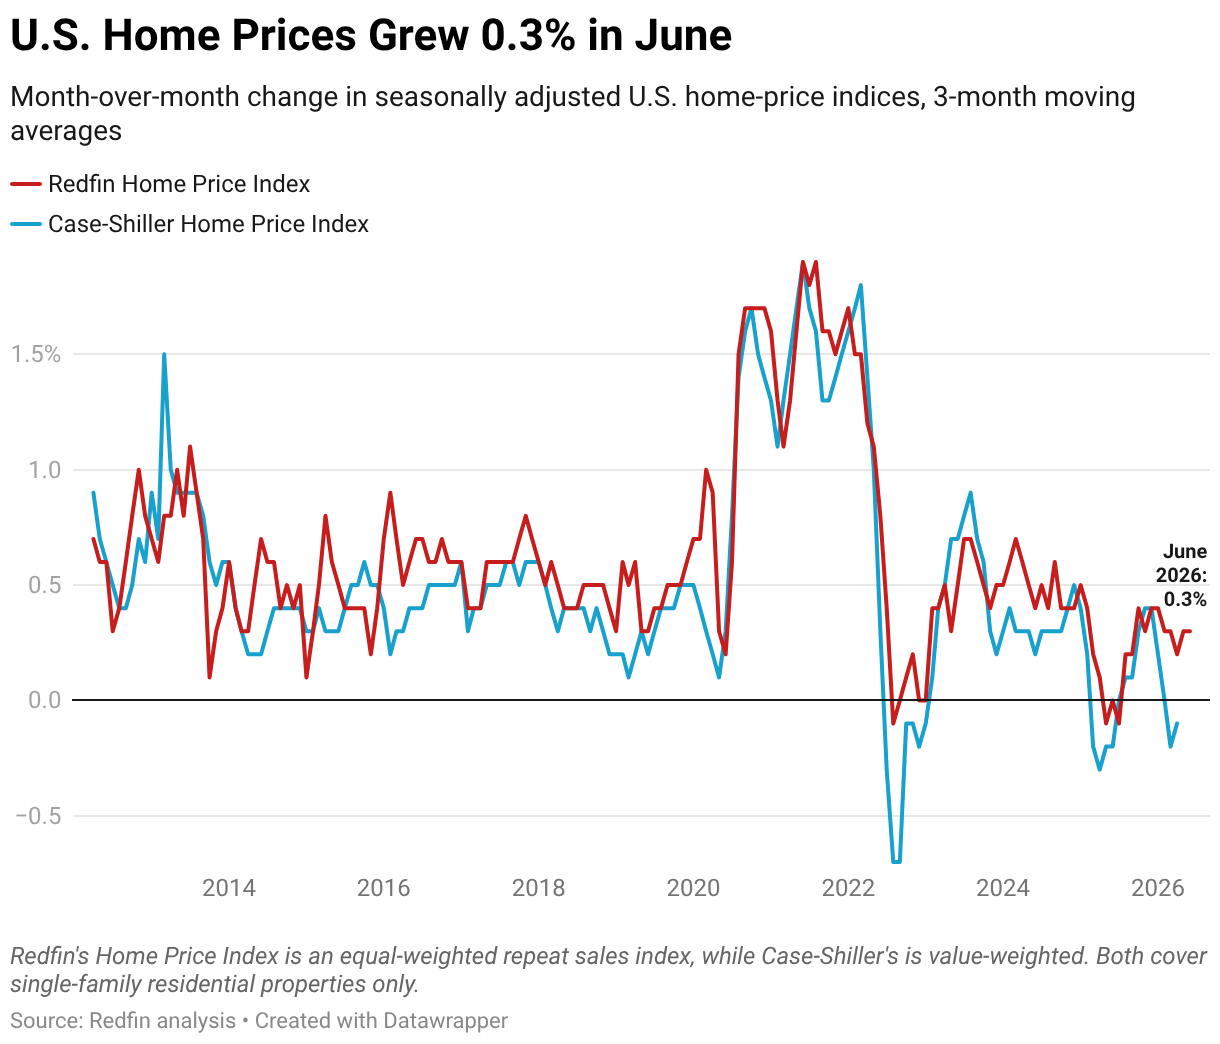
This is according to the Redfin Home Price Index (RHPI), which uses the repeat-sales pricing method to calculate seasonally adjusted changes in single-family home prices. The RHPI measures how sale prices of homes have changed since their previous sale—similar to the S&P Cotality Case-Shiller Home Price Indices—but is reported about a month earlier. June data covers the three months ending June 30, 2026. Read the full RHPI methodology here.
Despite stubbornly high mortgage rates and widespread economic uncertainty stemming partly from the Iran war, homebuying demand picked up at the start of summer. Although there are still hundreds of thousands more sellers than buyers in the U.S., Redfin agents in many parts of the country report that there aren’t enough affordable, move-in ready homes on the market to meet demand. That pushed home prices to a record high, and contributed to strong price growth in June.
The strong luxury market is another factor: Luxury home prices are rising three times faster than non-luxury prices. Wealthy homebuyers are having an outsized impact on home-price growth, especially in fast-moving luxury markets like San Francisco and South Florida. Redfin agents report that in many markets, affluent buyers are unfazed by high mortgage rates and economic uncertainty, choosing to forge ahead with home purchases while many average Americans are waiting on the sidelines.
“This summer’s home sellers and buyers should pay close attention to local trends; every housing market is definitely not equal,” said Sheharyar Bokhari, a senior economist at Redfin. “Sellers in strong buyer’s markets like Nashville or Austin, for instance, should recognize that while prices are rising to record highs nationwide, that’s not necessarily the case in their area; they may need to price lower than they want to attract buyers. But sellers in places with tighter inventory and strong demand from wealthy buyers, like San Francisco, hold more negotiating power and can likely command higher prices.”
Home Prices Are Rising in Most Major Metros, Led by Ohio
Home prices rose in 30 major U.S. metros month over month on a seasonally adjusted basis in June. Redfin analyzed the 50 most populous U.S. metro areas and included the 49 with sufficient data.
The biggest uptick was in Columbus, OH, where home prices rose 1.2% month over month. It’s followed by Miami (1.1%), Cincinnati (1%), Kansas City, MO (1%) and Warren, MI (0.8%).
Prices declined in 19 of the metros in this analysis, with the biggest drop in San Francisco (-1%). It’s followed by Baltimore (-0.8%), San Antonio (-0.4%), Denver (-0.4%) and Phoenix (-0.4%).
While San Francisco prices fell month over month, they’re soaring on a year-over-year basis, largely because of the AI boom. San Francisco home prices rose 10.8% year over year, the biggest increase in the country. It’s followed by Nassau County, NY (10.1%), Chicago (9.9%), Cleveland (9.3%) and Milwaukee (8.8%).
The biggest year-over-year declines were in San Antonio (-2.7%), Jacksonville, FL (-1.8%), Austin, TX (-1.7%), Dallas (-1.6%) and Phoenix (-1.4%). Prices are falling in those places because there are significantly more sellers than buyers, with sellers pricing lower to attract house hunters and, in some cases, buyers negotiating prices down.
| Metro-Level Summary: Redfin Home Price Index, June 2026 | ||
| U.S. metro area | Month-over-month change, seasonally adjusted | Year-over-year change |
| Anaheim, CA | 0.2% | 4.5% |
| Atlanta, GA | 0.7% | 0.2% |
| Austin, TX | 0.7% | -1.7% |
| Baltimore, MD | -0.8% | 2.8% |
| Boston, MA | 0.1% | 1.8% |
| Charlotte, NC | -0.1% | 4.0% |
| Chicago, IL | -0.4% | 9.9% |
| Cincinnati, OH | 1.0% | 4.9% |
| Cleveland, OH | 0.2% | 9.3% |
| Columbus, OH | 1.2% | 5.6% |
| Dallas, TX | 0.1% | -1.6% |
| Denver, CO | -0.4% | 0.6% |
| Detroit, MI | -0.1% | 5.7% |
| Fort Worth, TX | 0.2% | -0.5% |
| Houston, TX | -0.2% | -1.1% |
| Indianapolis, IN | -0.2% | 0.2% |
| Jacksonville, FL | 0.0% | -1.8% |
| Kansas City, MO | 1.0% | 3.6% |
| Las Vegas, NV | -0.3% | 0.6% |
| Los Angeles, CA | 0.5% | 3.4% |
| Miami, FL | 1.1% | 6.7% |
| Milwaukee, WI | -0.2% | 8.8% |
| Minneapolis, MN | 0.1% | 3.2% |
| Montgomery County, PA | -0.1% | 8.5% |
| Nashville, TN | 0.7% | 2.4% |
| Nassau County, NY | 0.5% | 10.1% |
| New Brunswick, NJ | 0.8% | 4.7% |
| New York, NY | 0.4% | 6.5% |
| Newark, NJ | -0.2% | 8.2% |
| Oakland, CA | 0.2% | 0.1% |
| Orlando, FL | 0.3% | -1.2% |
| Philadelphia, PA | 0.3% | 8.0% |
| Phoenix, AZ | -0.4% | -1.5% |
| Pittsburgh, PA | -0.1% | 3.2% |
| Portland, OR | 0.2% | 1.7% |
| Providence, RI | 0.2% | 5.3% |
| Riverside, CA | 0.6% | 0.5% |
| Sacramento, CA | -0.3% | -0.2% |
| San Antonio, TX | -0.4% | -2.7% |
| San Diego, CA | -0.1% | 1.8% |
| San Francisco, CA | -1.0% | 10.8% |
| San Jose, CA | 0.3% | 2.7% |
| Seattle, WA | -0.2% | -0.2% |
| St. Louis, MO | 0.2% | 3.5% |
| Tampa, FL | -0.1% | 3.0% |
| Virginia Beach, VA | 0.6% | 6.2% |
| Warren, MI | 0.8% | 4.8% |
| Washington, DC | 0.4% | 4.3% |
| West Palm Beach, FL | 0.6% | 4.6% |