Pandemic-era mortgages are driving a wedge in home equity trends
Mortgaged U.S. homeowners are sitting on a mountain of home equity, which in the second quarter of 2026 rose to about $18 trillion dollars.
In the world of large numbers, that’s on par with the average annual gross domestic product of China from 2015 to 2025. It portions out to an average of $310,000 in equity per mortgaged homeowner.
But as elevated inflation and rising housing costs buffet homeowners across the country, equity gaps across loan vintages and regional housing markets are widening, says real estate analytics firm Cotality. Recently published research from the company underscores how varying equity levels point to differing levels of resilience for U.S. homeowners.
Advertisement

“Homeowners have accumulated enormous amounts of equity, but most of it isn’t doing much,” Thom Malone, principal economist at Cotality, commented in the report.
Equity extraction reached about $58 billion in the second quarter, according to ICE Mortgage Technology, the second-highest level since the Federal Reserve hiked interest rates in 2022, officially ending the low-rate regime of the COVID-19 pandemic.
Experts tell Scotsman Guide that home equity lending is unlikely to cool down anytime soon. Entrenched lock-in effects and mounting economic pressure on household budgets are incentivizing homeowners to tap equity to manage monthly cash flows or fund renovations, instead of forfeiting ultra-low pandemic-era mortgages through new home purchases.
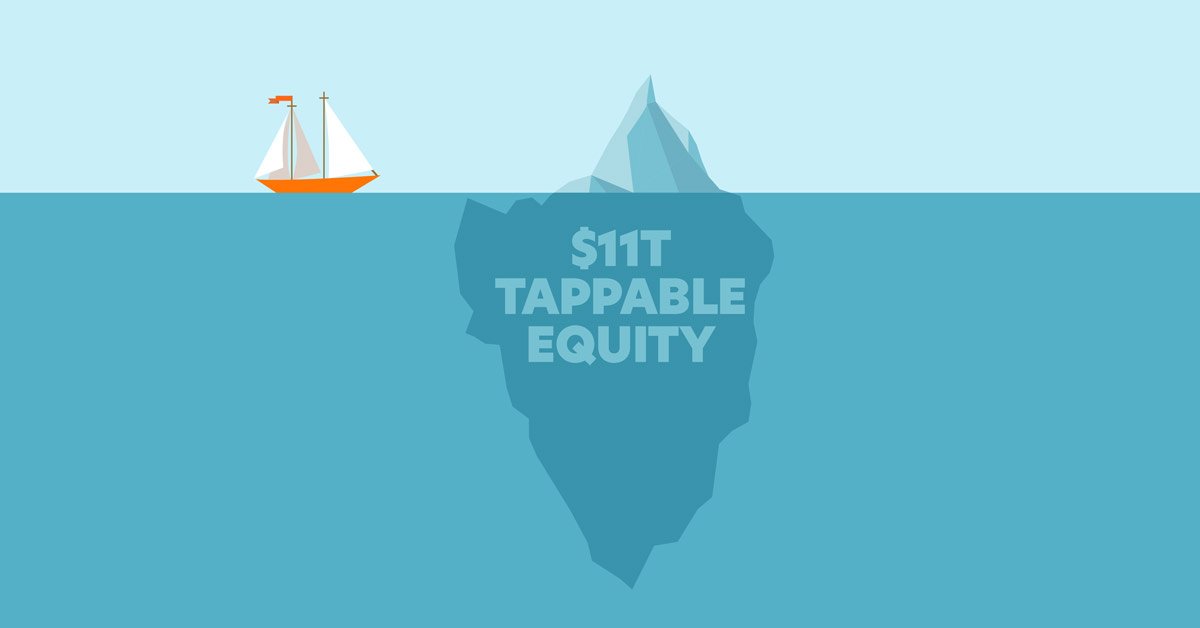
But the $58 billion of equity withdrawn in the second quarter is still just a drop in the bucket considering more than $11 trillion of equity was tappable during the quarter, meaning it could be withdrawn while borrowers maintained a 20% home equity cushion.
Malone believes equity extraction hasn’t accelerated more quickly because borrowers with the most housing wealth are typically the least likely to tap it.
“That means much of the country’s record home equity remains on the sidelines, while the same homeowners continue to benefit from the lower monthly payments that helped create it in the first place,” he added.
Pandemic-era mortgages are distorting equity trends
Homebuyers in 2020 and 2021, Malone assesses, accumulated $86,000 more home equity than post-2022 buyers “due to rapid home price surges.” Those same borrowers are protecting mortgage-rate nest eggs, saving them about $915 per month compared to buyers who purchased in 2023.
“Pre-2023 buyers are locked into incredibly low mortgage rates that provide monthly margin for them to build wealth outside their homes,” said Malone. “That advantage won’t be erased over time.”
Furthermore, lower mortgage payments leave those households with stronger monthly cash flow, reducing the need to consolidate debt, finance renovations or take out a line of credit for other expenses through home equity products.
Meanwhile, post-2022 originations are making up a growing share of mortgage delinquencies and home foreclosures, as borrowers with those lower-equity, higher-rate loans face increasing payment stress.
Foreclosure data from May shows post-2022 purchases comprised 39% of May foreclosure starts, 34% of active foreclosure inventory and 43% of foreclosure sales.
Home equity remained heavily concentrated in states across the West and Northeast during the second quarter. Average homeowner equity topped out $644,000 per borrower in Hawaii, followed by $623,000 per borrower in California and $486,000 in Massachusetts.
Seven of the top 10 states for highest homeowner equity were in the Northeast. New Hampshire borrowers, in the No. 10 spot, still averaged more than $350,000. At the other end of the spectrum, the lowest average equity levels during the second quarter were concentrated in the South and Midwest.
Louisiana recorded the lowest average homeowner equity per borrower at $109,000, followed by Oklahoma at $124,000 and Iowa at $125,000. West Virginia, Mississippi, Missouri, Kentucky, South Dakota, North Dakota and Nebraska rounded out the bottom 10 states — none of which exceeded $175,000 in average borrower equity.
The gap between states with the highest and lowest average borrower equity stood at roughly $395,000 during the first quarter of 2020. By the second quarter of 2026, that gap had expanded to $534,000.
“These regional differences have widened considerably over the course of the decade as home-price appreciation has increasingly benefited already high-equity markets,” concluded Cotality.