List: Which everyday expenses are hitting your pocket harder as CPI crosses 6%, food inflation nears 9% in Oct 2026?
India’s retail inflation accelerated in October 2026, putting household budgets under pressure as prices of several essential goods and services continued to rise. Consumers faced higher inflation in food, transport, clothing, restaurants and other everyday expenses, adding to the cost of managing monthly household budgets.
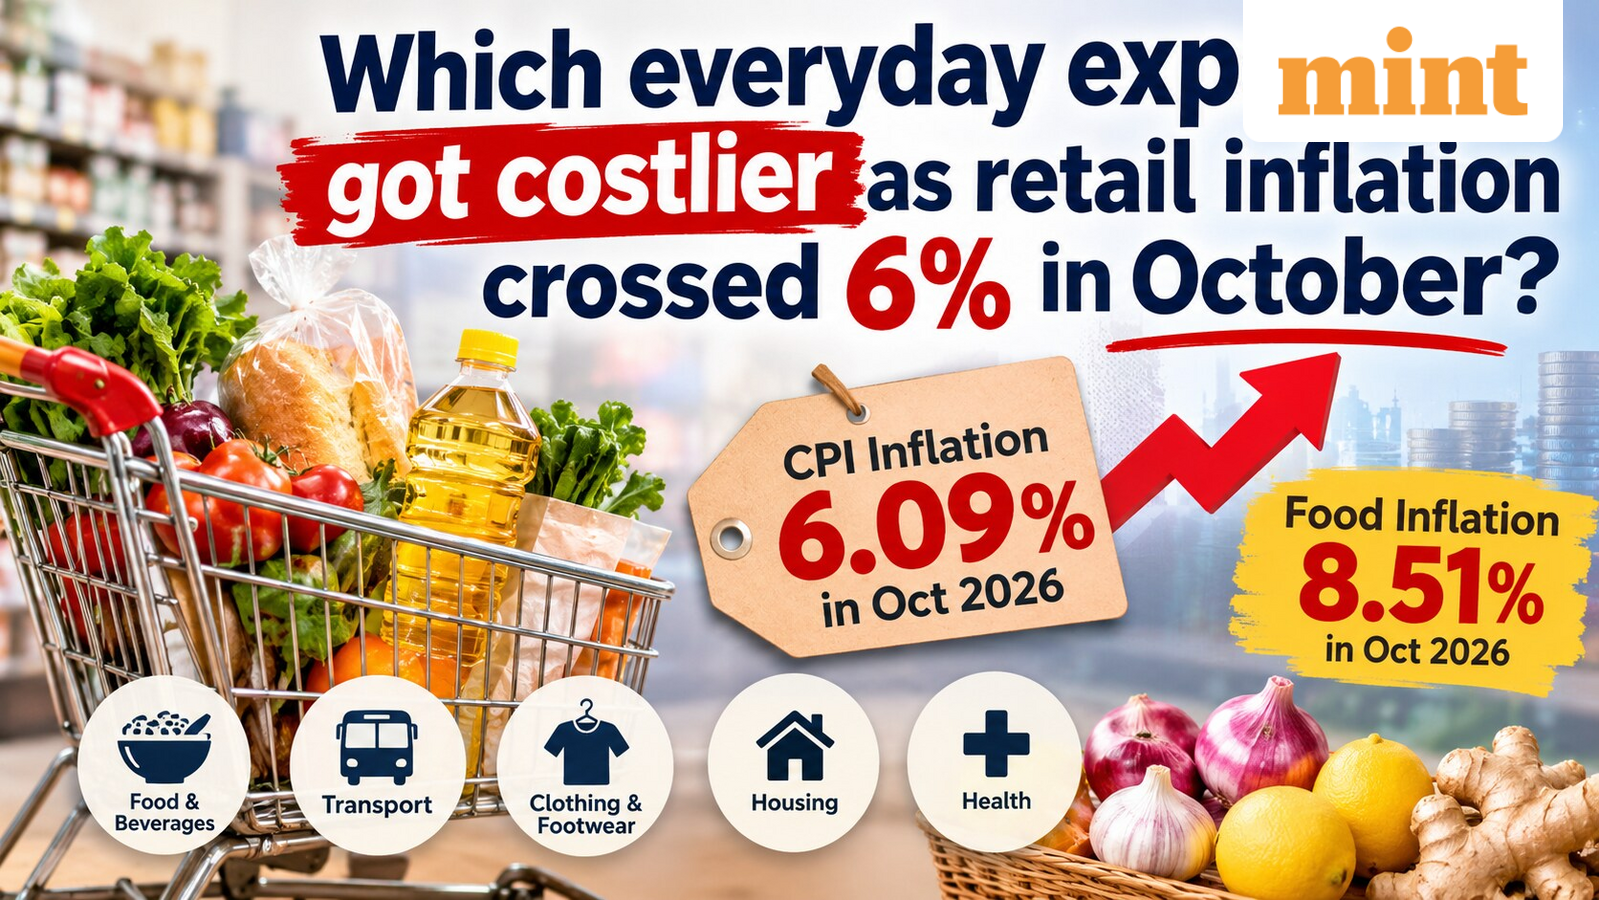
The Consumer Price Index (CPI) inflation rose to 6.09% in October 2026, from 5.54% in September 2026, crossing the Reserve Bank of India’s (RBI) upper tolerance limit of 6%.
Food inflation also increased to 8.94% from 7.74% during the same period, according to data released by the Ministry of Statistics and Programme Implementation (MoSPI) on Thursday.
Here is a look at the everyday expenses that are becoming costlier and how their inflation rates changed in October.
What is CPI inflation?
The Consumer Price Index (CPI) measures changes in the prices of goods and services that households regularly purchase. These include food, beverages, clothing, housing, transport, healthcare, education, and other everyday necessities.
For example, if a household basket cost ₹100 in October 2025 and costs ₹106.09 in October 2026, it represents a 6.09% increase in consumer prices over the year.
Which products recorded the highest inflation in October 2026?
| Item | Inflation October 2026 (%) | Inflation September 2026 (%) |
| Onion | 116.22 | 108.13 |
| Garlic | 60.74 | 54.62 |
| Silver jewellery | 52.39 | 87.82 |
| Ginger | 48.32 | 62.85 |
| Lemon | 47.30 | 36.41 |
Source: MoSPI; top five items recording the highest inflation at the all-India combined level.
At the all-India combined level, onion recorded the highest inflation among the listed individual items at 116.22% in October, up from 108.13% in September. This means onion prices were more than twice their year-ago level.
It is important to note that inflation figures represent year-on-year changes in prices, not month-on-month price increases.
Garlic followed, with inflation rising to 60.74% from 54.62%. Ginger inflation also eased to 48.32% from 62.85%, while lemon prices recorded inflation of 47.30%.
Which other everyday expenses got expensive in October 2026?
Apart from individual products, inflation increased across 11 of the 12 major consumption divisions in October compared with September.
Personal care, social protection and miscellaneous goods and services recorded the highest category-level inflation at 10.14%. However, this was lower than 13.75% in September. But the CPI measures price changes against the corresponding period a year earlier.
| Category | October 2026 (%) | September 2026 (%) |
| Personal care, social protection and miscellaneous goods and services | 10.14 | 13.75 |
| Restaurants and accommodation services | 10.06 | 9.36 |
| Food and beverages | 8.51 | 7.36 |
| Transport | 5.84 | 5.01 |
| Clothing and footwear | 4.96 | 3.93 |
| Paan, tobacco and intoxicants | 4.93 | 4.80 |
| Education services | 4.02 | 3.94 |
| Furnishings, household equipment and routine household maintenance | 3.94 | 3.11 |
| Information and communication | 3.16 | 2.44 |
| Housing, water, electricity, gas and other fuels | 2.90 | 2.74 |
| Recreation, sport and culture | 2.52 | 2.16 |
| Health | 2.05 | 1.40 |
Source: MoSPI; division-wise inflation at the all-India combined level.
Restaurants and accommodation services recorded inflation of 10.06%, while food and beverages inflation increased to 8.51% in October.
Transport inflation rose to 5.84% in October from 5.01% in September, while clothing and footwear inflation increased to 4.96% from 3.93%.
Healthcare recorded the lowest inflation among these categories at 2.05%, although it was higher than 1.40% in September.
Food and beverages carry the highest weight in the CPI basket at 36.75% in MoSPI data. Therefore, the increase in food inflation to 8.51% is particularly significant for household budgets, as sustained price pressures in this category can affect consumers’ monthly grocery spending.
Disclaimer: This story is for informational purposes only. Inflation figures are based on MoSPI data and may not reflect actual price changes experienced by individual households.