Millennials Had It Better Than Baby Boomers–Until the Pandemic Changed the Math
- Timing made a big difference for millennials. Those who bought a home before 2022 locked in historically low mortgage rates. But those who bought after rates and prices surged spent about 35% of their income on housing–and many other millennials were priced out entirely.
- Baby boomers had a brutal start, with double-digit mortgage rates in the early 1980s, but falling rates gave them decades to refinance. When boomers were in their late 30s, they spent just over 25% of their income on housing.
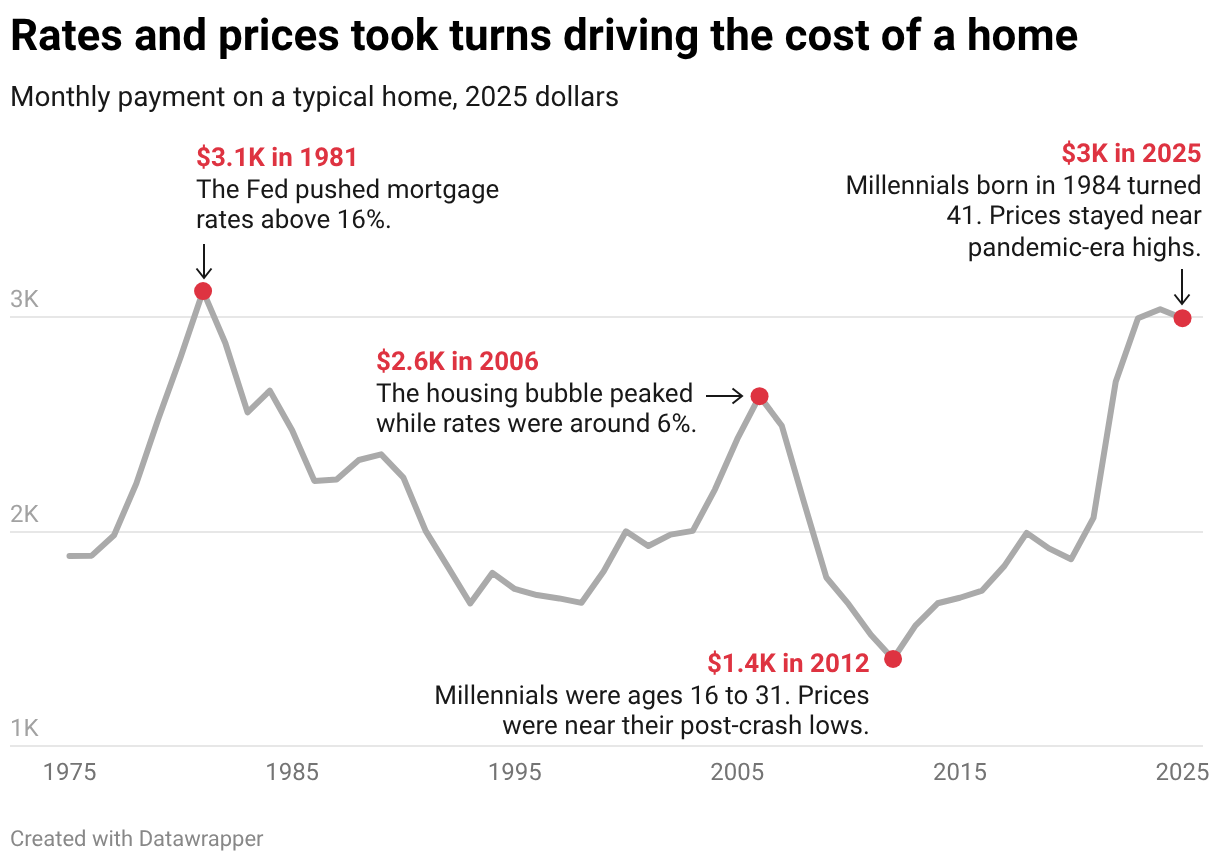
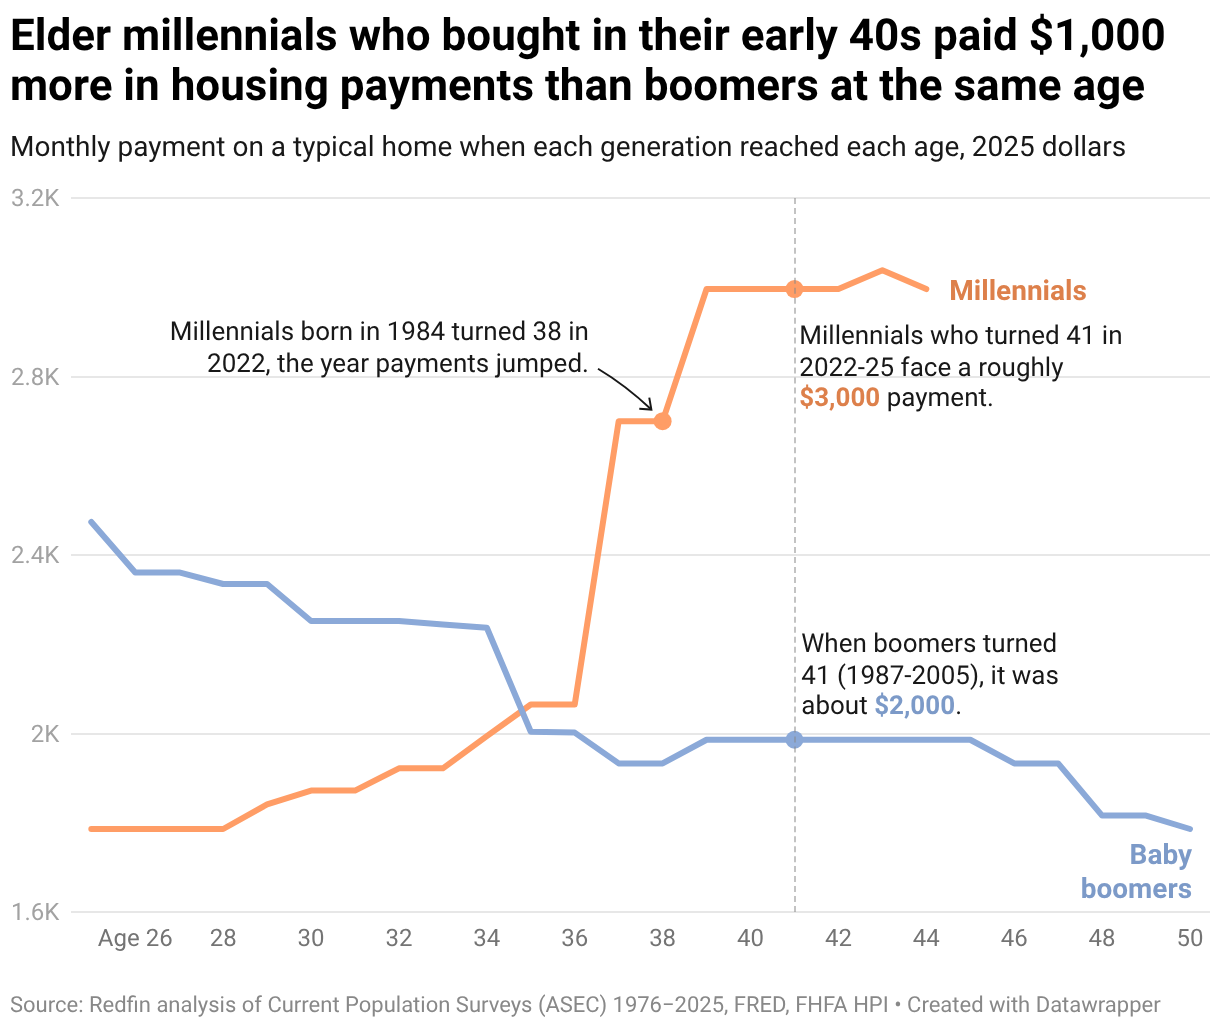
- The typical monthly payment was about $3,000 when elder millennials were 40 to 44 (2021 to 2025), versus about $1,986 for boomers at those ages, in today’s dollars.
- Millennials earn more than boomers did at the same age in today’s dollars, partly because more women are in the workforce, but housing costs more than cancel out the difference.
If millennials hadn’t spent so much money on avocado toast, they’d all own their dream home by now–right? Wrong. Just over half of millennials own their home. For the rest, housing costs have soared so much in recent years that skipping the avocado toast in their 20s wouldn’t have made a dent.
The story isn’t about constant struggle, though–it’s about timing. Elder millennials who bought a home in their early 30s had it better than baby boomers did at the same age: Historically low mortgage rates and higher household incomes meant those millennials spent about 27% of their income on housing at age 30, compared with 36% for boomers. Then the pandemic changed the math. Mortgage rates jumped from around 3% to nearly 7%, and home prices surged. Since rates rose above 6% in 2022, elder millennials have spent up to 35% of their income on monthly mortgage payments, compared with roughly 25% for boomers at the same age–even though millennials earn more, adjusted for inflation.
Boomers might point out that mortgage rates were much higher in their day. They’d be right: Rates peaked at over 16% in 1981 and stayed in double digits for much of the decade. But prices were lower. In the 1980s, when many boomers were in their 30s, the typical U.S. home sold for about $235,000 to $265,000 in today’s dollars. When elder millennials reached the same age–prime homebuying age–in the 2010s and 2020s, typical prices ranged from about $275,000 to $455,000.
Key takeaway: Buying at the wrong time was painful for both generations, but boomers had a better chance to recover. Falling rates throughout the late 1980s, 1990s and early 2000s gave them many opportunities to refinance into lower payments. Millennials who bought before 2022 secured historically low mortgages; those who bought later—or never managed to buy—face a much less forgiving market. Of course, it’s possible the market could become more forgiving for millennials over time; rates may eventually fall significantly enough that many millennials have the opportunity to refinance into lower payments.
This is based on an analysis of Redfin and U.S. Census data. A few notes to help contextualize the numbers: All dollar figures are adjusted for inflation. Much of the data illustrates each generation’s typical experience at a given age, combining everyone in that generation who has reached that age, whenever that happened for them. Because millennials are still aging into their 40s, for example, our 40-to-44 figures only capture the oldest millennials, who hit those ages between 2021 and 2025. All boomers have been through that age range, so their figures include the whole generation. Please see the end of this report for a detailed methodology.
Millennials Had an Early Homebuying Advantage
In their early 30s, elder millennials who bought a home spent a smaller share of their income on housing than boomers did at the same age, despite much higher home prices. Imagine a median-earning millennial born in 1984 who bought a home at age 30. They would have spent around 27% of their income to purchase the typical home, within the “don’t spend more than 30% of your income on housing costs” rule of thumb.
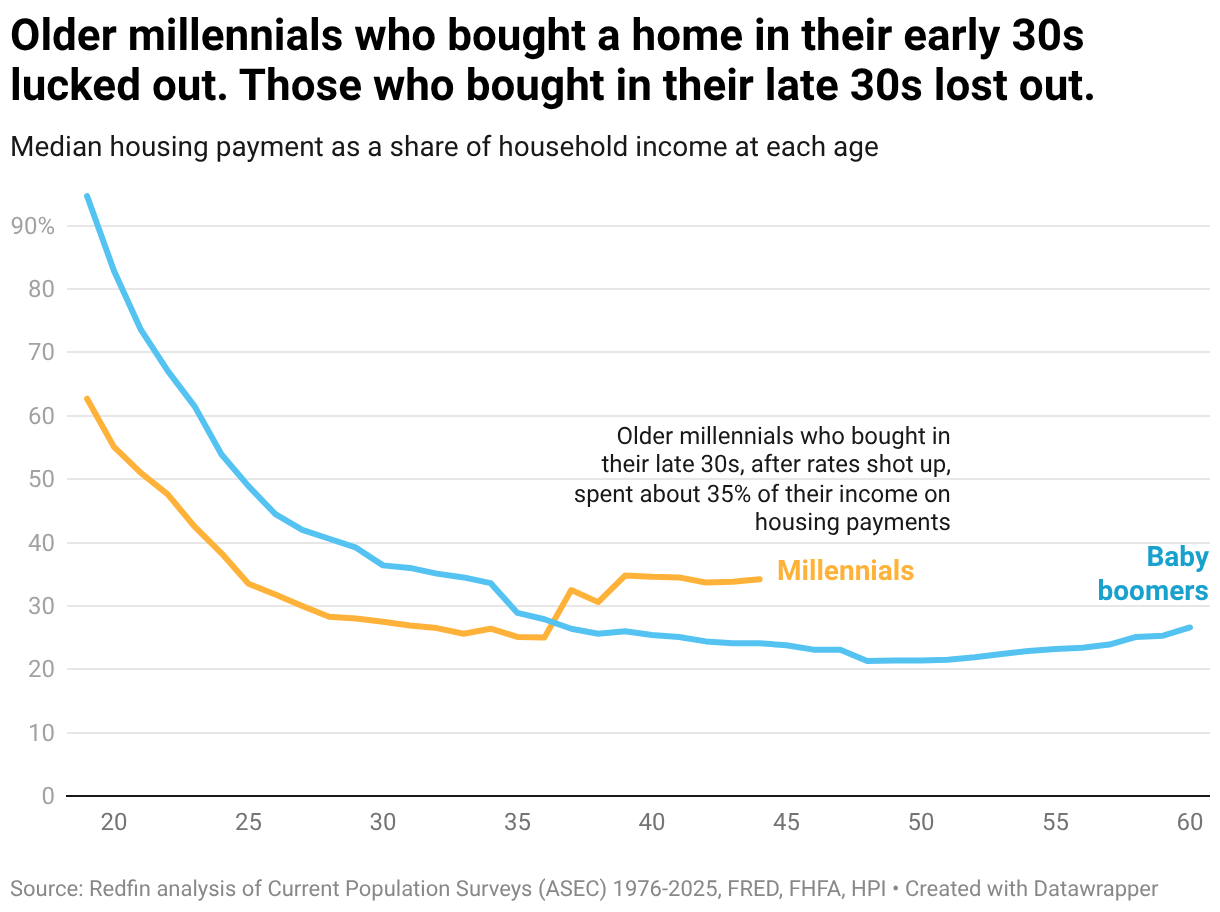
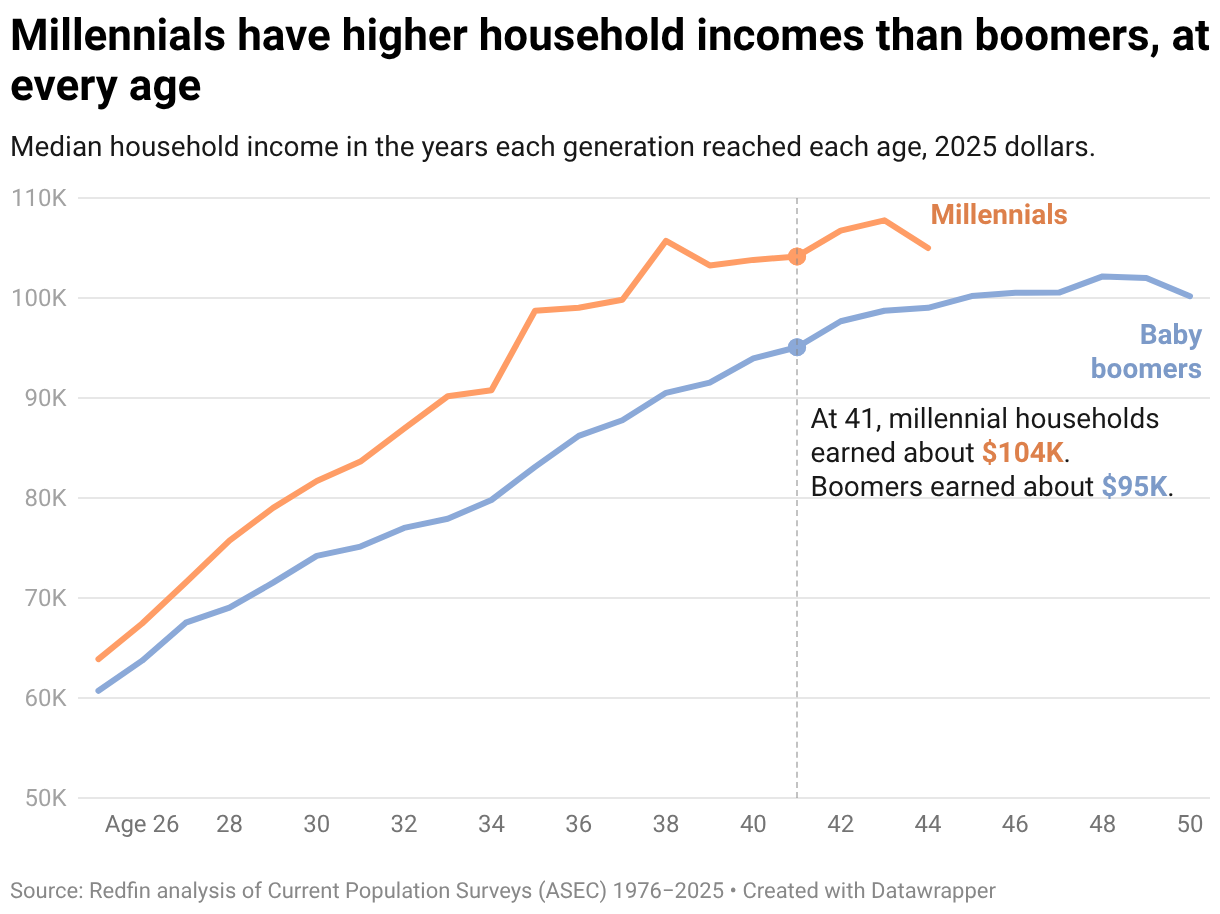
Two factors helped: cheap borrowing and higher household incomes. Millennials benefited from roughly a decade of historically low mortgage rates; they fell below 3% in 2021. Millennials also tend to have higher household incomes than boomers did at the same age. At age 37, the typical elder millennial household earned an average of $100,000, compared with $88,000 when boomers were that age. The discrepancy is partly because two-income households are more common today. About 78% of women participate in the U.S. workforce, up from roughly 60% in 1980. It’s also worth noting that millennials typically work similar hours for more money than baby boomers at the same life stage.
Then the Math Changed
The millennial advantage didn’t last. Mortgage rates jumped from around 3% in late 2021 to nearly 7% in late 2022, after home prices had surged about 40% nationwide during the pandemic homebuying frenzy. Rising rates often cool prices, but this time, prices didn’t fall. That mix of high prices and mortgage rates that had doubled from their pandemic-era low meant Americans had to spend a much higher share of their income to buy a home. Imagine that same millennial, born in 1984: If they bought a home at age 40 instead of 30, their housing costs shot up to about 35% of their income.
Rising prices and rates also priced many Americans completely out of the housing market, which is why elder millennials have a lower homeownership rate than baby boomers at the same age.
“For millennials who haven’t yet bought a home, affordability is a challenge. But it’s important to remember that you’re not trying to climb Mount Everest, you’re just trying to get back to 2018 or 2019, which was the last time the average homebuyer was spending just about 30% of their income on housing,” said Chen Zhao, Redfin’s head of economic research. “Before the pandemic, younger generations actually had it easier than the ones before them. But then home prices surged during the pandemic homebuying frenzy and mortgage rates shot up, while incomes kept growing at a normal pace–and the advantage flipped. If you bought in 2020 or 2021, you’re coming out ahead, but those years were the exception, not the rule. One piece of hope for younger Americans who haven’t yet bought a home: Home prices are already falling in parts of the U.S. and they’re softening in others, which means we could be headed back to 2018 or 2019 levels sooner rather than later.”
Millennials are also contending with other major expenses; childcare costs are squeezing them particularly hard. A recent Redfin analysis found that housing and childcare consume more than half of the typical American’s household income. Student loans are another big expense; millennials have significantly more student loan debt than boomers did at the same age.
Adult Gen Zers, who are in their twenties, are tracking behind millennials at the same stage of life. Gen Zers have spent anywhere from 40% of 60% of their income to buy the typical home since they’ve reached homebuying age. That’s partly because they’re still young enough that they haven’t yet hit their earnings peak, so their current income is lower than older generations, and partly because housing costs are higher than in the past. But as Gen Zers move through their careers, their earnings are likely to grow substantially, as they have for every generation before them. Combined with a gradual normalization in housing costs, homeownership should become increasingly attainable over time.
Baby Boomers Had a Tough Road Early On, Then Got Relief
Baby boomers faced their own affordability crisis when they were young, in the 1980s. In their early 20s, the typical boomer household who bought a home would have spent more than 60% of its income on housing costs, reflecting the era’s runaway inflation and double-digit mortgage rates.
But their housing burden fell quickly as they aged, dropping to around 40% of income by their late 20s and 26% by their late 30s. Baby boomers’ homeownership rate steadily rose from about half in 1985 to over 70% by the late 1990s, and it kept climbing after that. By their 40s and 50s, the share of homebuyers’ income spent on housing had settled into the low-to-mid 20% range, lower than millennials at the same point in their life.
Much of that relief came from the same force that had hurt them initially—mortgage rates—as rates gradually declined through the 1980s and 1990s, letting many boomers refinance into far more manageable payments even as home prices kept climbing.
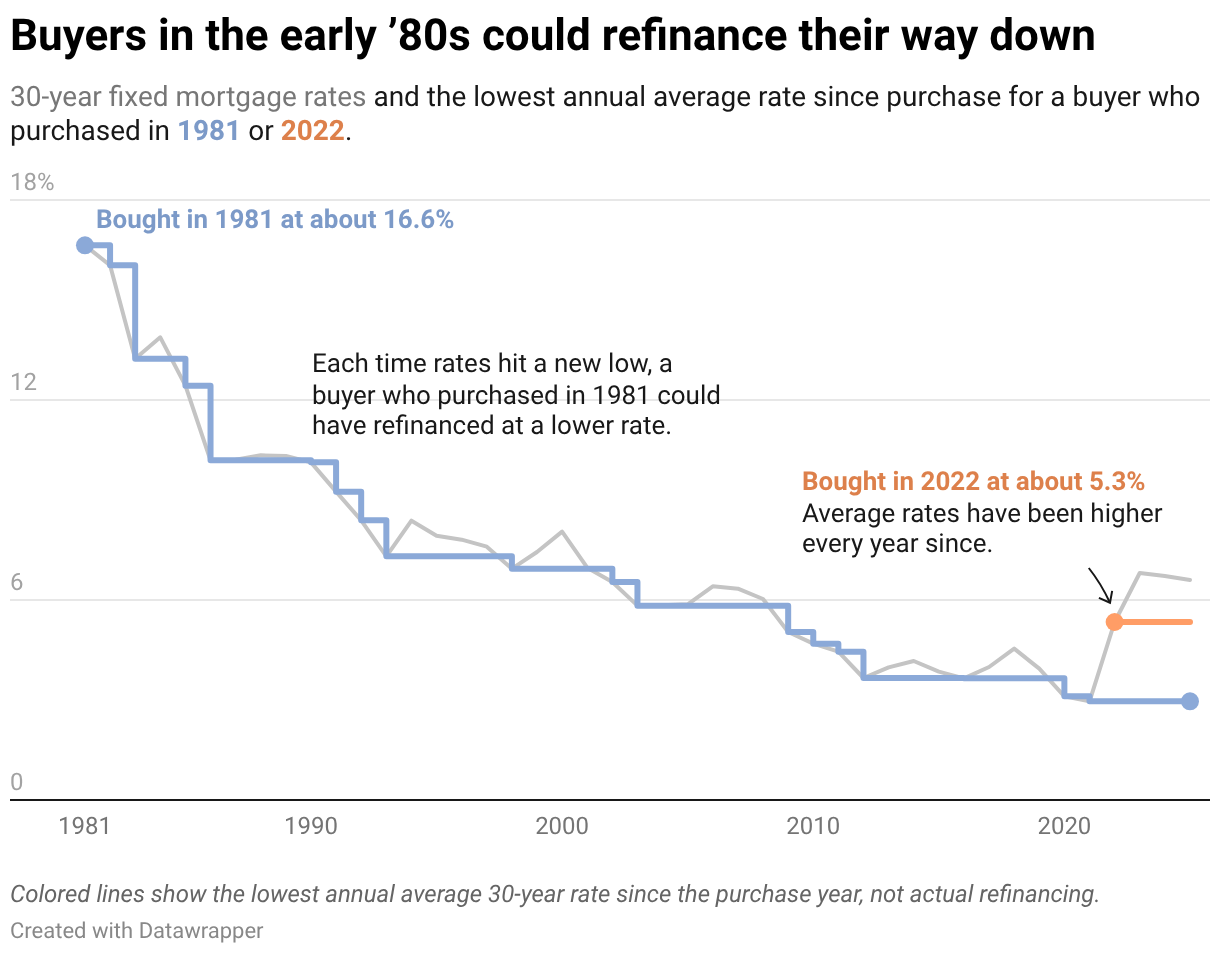
Millennials haven’t had the same opportunity. Those who bought before 2022 locked in historically low rates, while those who bought later faced a costly combination of high prices and climbing rates. Would-be buyers who couldn’t afford that combination were left out altogether.
“The housing market has historically been better for baby boomers than younger generations because lower home prices and higher rates are preferable to higher home prices and lower rates,” Zhao said. “You can refinance your rate into a lower housing payment, and that’s exactly what boomers did: They refinanced for up to 40 years as rates kept falling. Then home prices soared, which is why a lot of boomers are rich in real estate.”
That dynamic shows up clearly when you ask people directly. In a recent Redfin survey, more than three-quarters (76%) of baby boomers homeowners said they can easily afford their payment, while the rest struggle. Roughly half (53%) of millennial homeowners can easily afford their payment, and the other half struggle.
The same generational squeeze shows up in the reasons people are staying put in their current home. Among people unlikely to move soon, 43% of millennials cited high home prices as a reason, compared with 31% of boomers. Three in 10 (30%) millennials pointed to high mortgage rates, versus just 18% of boomers, likely because many baby boomers have paid off their mortgage and built up substantial equity. This is from a Redfin survey conducted by Ipsos in May 2026, fielded to 4,000 U.S. residents.
Two Couples, Two Very Different Housing Opportunities
Consider two hypothetical couples. Alex and Jordan are millennials born in 1984 and live on two incomes, a common setup for millennial households. Pat and Chris are baby boomers born in 1956 and got by on one, more typical for their generation. The numbers below show what it would have cost each couple to buy a home to buy a home in their early 30s and their late 30s.

Methodology
This analysis uses income data from 1976 to 2025 from the U.S. Census Bureau’s Current Population Survey Annual Social and Economic Supplement (CPS ASEC), accessed through IPUMS. The sample includes household heads aged 19 and older, and results are weighted using CPS household weights.
Generations are defined by birth year:
- Baby boomers: 1946–1964
- Gen X: 1965–1980
- Millennials: 1981–1996
- Gen Z: 1997–2012
Each household is assigned to a generation based on the age of the household head in the survey year.
Home prices. We start with the 2025 median sale price of U.S. single-family homes from Redfin data ($456,409). Prices for earlier years are estimated by scaling that 2025 price back using the S&P Cotality Case-Shiller U.S. National Home Price Index from 1987 onward and the FHFA All-Transactions House Price Index for years before 1987. Both indexes are averaged by year.
Monthly housing payment. For each year, we calculate the monthly payment to buy a median-priced home. It covers principal, interest, property taxes and homeowners insurance. We assume:
- a 20% down payment
- a 30-year fixed-rate mortgage at that year’s average rate from Freddie Mac’s Primary Mortgage Market Survey
- annual property taxes equal to 0.5% of the home price
- annual homeowners insurance equal to 1.25% of the home price
Income and inflation. Household income is total household income as reported in the CPS ASEC. All income and payment figures are converted to 2025 dollars using the Consumer Price Index for All Urban Consumers (CPI-U).
Share of income spent on housing. For each generation and age, we calculate the median monthly housing payment and the median household income, and divide the payment by one-twelfth of the income.
How to read the results by age. Much of the data in this report shows each generation’s typical experience at a given age. Because a generation spans many birth years, people born at the start of that generation turn, say, 40 in a different calendar year than people born at the end of it. For this analysis, each age point combines averages for everyone from that generation who has reached that age, in whatever year that actually was for them. For instance, millennials (born 1981 to 1996) have only had the oldest members of their generation—those born in the early-to-mid 1980s—reach their 40s so far. So when we show what the typical 40-to-44-year-old millennial paid for housing, we’re only capturing people who hit that age between 2021 and 2025. Younger millennials haven’t gotten there yet. Baby boomers (born 1946 to 1964) are fully through that age range, their 40-to-44 data point include averages from all boomers.