U.S. Home Prices Ticked Up 0.25% in September
- Home prices rose 0.25% nationwide in September, up slightly from 0.21% in August.
- Prices grew month over month in 34 of the 50 most populous U.S. metros, with the fastest growth in Philadelphia and Pittsburgh.
- Prices declined in 16 metros, led by Fort Worth, a major buyer’s market.
U.S. home prices increased 0.25% month over month in September on a seasonally adjusted basis. That’s up slightly from a 0.21% growth rate the previous month, and in line with the modest gains we have seen since spring.
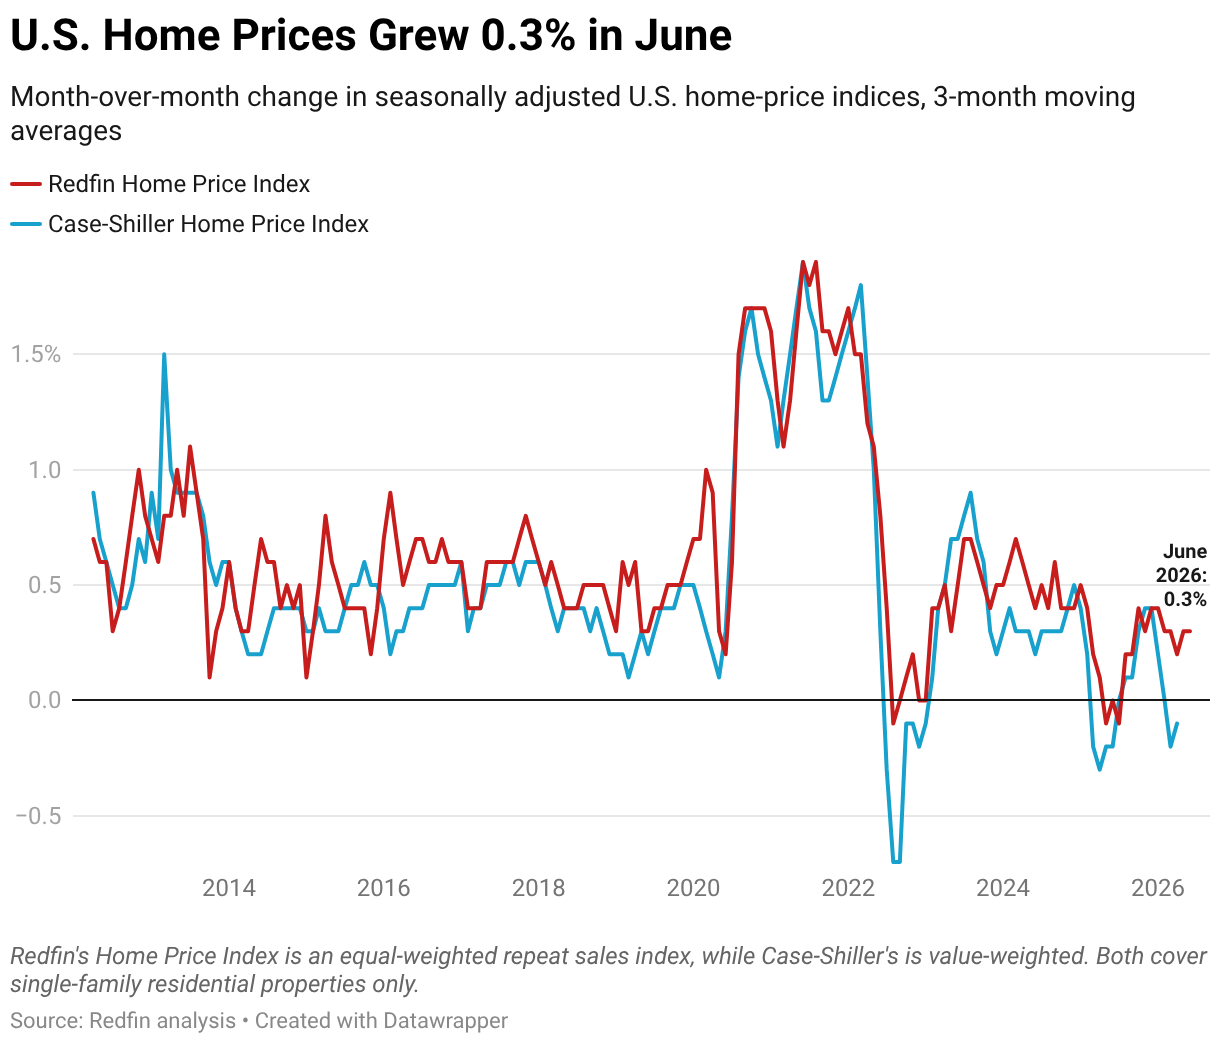
Prices rose 3.8% from a year earlier in September, the fastest annual growth rate since June 2025.
This is according to the Redfin Home Price Index (RHPI), which uses the repeat-sales pricing method to calculate seasonally adjusted changes in single-family home prices. The RHPI measures how sale prices of homes have changed since their previous sale—similar to the S&P Cotality Case-Shiller Home Price Indices—but is reported about a month earlier. September data covers the three months ending September 30, 2026. Read the full RHPI methodology here.
Even though buyers have more negotiating power than they’ve had in over a decade, prices are still climbing a little each month. That’s mostly because sellers aren’t desperate: a lot of homeowners have built up enough equity that they’d rather wait than accept a lowball offer–and some are delisting. That keeps a floor under prices. Stronger demand in the luxury market is propping up prices, too.
One way to arrive at the right asking price is by using Redfin Early Access, which allows sellers to test the market before officially listing their home.
Home Prices Are Rising Most in Pennsylvania
Home prices rose in 34 of the 50 most populous U.S. metros month over month in September.
The biggest increases were in Pennsylvania: Philadelphia, where home prices rose 1.9% month over month on a seasonally adjusted basis, and Pittsburgh, where they rose 1.3%. They’re followed by Miami (1.3%), Chicago (1%) and San Francisco (1%). In places like Philadelphia, Pittsburgh and Chicago, buyers are finding comparatively cheap homes, leading to more demand than other parts of the U.S. San Francisco’s market is hot, thanks largely to AI wealth.
On a year-over-year basis, prices rose most in San Francisco in September, with a 14% increase. Next come West Palm Beach, FL (10.4%), Chicago (10.3%), Miami (8.2%) and Philadelphia (7.6%).
Home Prices Are Falling Most in Texas
Home prices fell in 16 of the 50 most populous U.S. metros. The biggest price declines were in Fort Worth, TX (-0.9% month over month) and New Brunswick, NJ (-0.6%). Next come Dallas, Seattle and Nassau County, NY, each of which posted a decline of -0.4%. Prices are ticking down in those Texas metros because they are among the biggest buyer’s markets in the nation. Seattle is also a buyer’s market. In those places, sellers may need to lower prices to attract buyers.
On a year-over-year basis, prices dipped in just six major metros, five in Texas plus Seattle. San Antonio (-2.1%) had the biggest drop, followed by Dallas (-1.5%), Austin (-0.2%), Seattle (-0.2%) and Houston (-0.1%).
For more on Redfin’s Home Price Index, please visit our Data Center.
| Metro-Level Summary: Redfin Home Price Index, September 2026
50 most populous U.S. metro areas |
||
| U.S. metro area | Month-over-month change, seasonally adjusted | Year-over-year change |
| Anaheim, CA | 0.1% | 5.6% |
| Atlanta, GA | 0.9% | 4.4% |
| Austin, TX | 0.0% | -0.2% |
| Baltimore, MD | 0.8% | 7.4% |
| Boston, MA | 0.6% | 3.3% |
| Charlotte, NC | 0.6% | 3.1% |
| Chicago, IL | 1.0% | 10.3% |
| Cincinnati, OH | 0.0% | 6.3% |
| Cleveland, OH | 0.3% | 7.3% |
| Columbus, OH | 0.3% | 5.3% |
| Dallas, TX | -0.4% | -1.5% |
| Denver, CO | 0.7% | 2.0% |
| Detroit, MI | 0.7% | 6.9% |
| Fort Lauderdale, FL | -0.1% | 2.3% |
| Fort Worth, TX | -0.9% | -0.1% |
| Houston, TX | -0.4% | -0.1% |
| Indianapolis, IN | 0.6% | 1.9% |
| Jacksonville, FL | 0.6% | 1.5% |
| Kansas City, MO | 0.1% | 2.9% |
| Las Vegas, NV | -0.1% | 1.3% |
| Los Angeles, CA | -0.3% | 3.3% |
| Miami, FL | 1.3% | 8.2% |
| Milwaukee, WI | 0.5% | 7.2% |
| Minneapolis, MN | 0.2% | 3.8% |
| Montgomery County, PA | 0.5% | 7.1% |
| Nashville, TN | 0.0% | 2.9% |
| Nassau County, NY | -0.4% | 7.5% |
| New Brunswick, NJ | -0.6% | 4.5% |
| New York, NY | 0.3% | 7.4% |
| Newark, NJ | 0.5% | 6.2% |
| Oakland, CA | 0.5% | 4.6% |
| Orlando, FL | 0.1% | 2.5% |
| Philadelphia, PA | 1.9% | 7.6% |
| Phoenix, AZ | -0.1% | 0.6% |
| Pittsburgh, PA | 1.3% | 6.6% |
| Portland, OR | -0.3% | 1.1% |
| Providence, RI | 0.7% | 6.5% |
| Riverside, CA | -0.4% | 0.9% |
| Sacramento, CA | 0.7% | 1.8% |
| San Antonio, TX | -0.4% | -2.1% |
| San Diego, CA | 0.1% | 4.0% |
| San Francisco, CA | 1.0% | 14.0% |
| San Jose, CA | 0.7% | 2.9% |
| Seattle, WA | -0.4% | -0.2% |
| St. Louis, MO | 0.3% | 4.1% |
| Tampa, FL | -0.2% | 4.7% |
| Virginia Beach, VA | -0.4% | 5.6% |
| Warren, MI | 0.3% | 2.7% |
| Washington, DC | -0.2% | 4.0% |
| West Palm Beach, FL | 0.4% | 10.4% |