₹8.81 cr average price for branded homes; Delhi-NCR leads with 47% supply | Personal Finance
Branded luxury homes in India command an average ticket size of ₹8.81 crore, with buyers in Pune paying a premium of 44% over comparable residential projects, highlighting the growing appeal of brand-led luxury housing. Delhi-NCR accounts for 47% of the country’s branded-residence supply, while developers launched 3,181 units in 2025, more than three times the 1,015 units added in 2024, according to a report by real estate data analytics firm CRE Matrix.
West (₹10.8 Cr) and North (₹9.5 Cr) set the top of the market, both above the ₹8.81 Cr pan-India average.
The cumulative reported transaction value of branded residences reached ₹47,278 crore between 2018 and September 2026, with transaction value growing at a compound annual growth rate of around 49% between 2019 and 2025, the report said.
Developers added another 1,975 units in the first nine months of 2026, taking cumulative supply across the 10 markets covered by the report to 10,452 units. Buyers had absorbed 68% of this cumulative supply. Of the 1,975 units launched during January-September 2026, 1,616 were absorbed.
“Branded residences have moved from a niche product to a core segment of India’s luxury housing market,” Abhishek Kiran Gupta, co-founder and chief executive officer of CRE Matrix, said in the report.
Pune leads on premium pricing
Pune recorded the highest premium for branded residences at 44% over comparable projects in the same catchment areas, followed by Kolkata at 42%. Bengaluru recorded a premium of 32%, while Gurugram stood at 29%. Noida and Mumbai each registered a premium of 26%, and Hyderabad had the lowest premium among the seven cities at 25%.
The average premium across the seven cities was approximately 32%, according to CRE Matrix.
The regional ticket-size comparison shows a wide gap across markets. West India recorded the highest weighted-average ticket size at ₹10.8 crore, followed by North India at ₹9.5 crore. South India stood at ₹7.3 crore, while East India had an average ticket size of ₹2.6 crore.
The West’s average ticket size was 4.2 times that of the East, reflecting differences in the pricing and composition of branded-residence supply across regions.
Delhi-NCR accounts for nearly half of supply
North India held 47% of the cumulative branded-residence supply, with 4,939 units, followed by West India with 3,240 units, or 31%. East India accounted for 1,397 units, or 13%, while South India had 876 units, or 8%.
The North’s lead has widened during the recent launch cycle. It accounted for 3,891 of the 5,156 units launched across the four regions in 2025 and the first nine months of 2026.
Delhi-NCR had the highest number of projects among the markets covered, at 15. Mumbai and Pune had six projects each, followed by Kolkata with three. Bengaluru and Hyderabad had two projects each, while Lonavala, Alibaug, Bhubaneswar and Chennai had one project each.
The concentration of supply in the North and West highlights the importance of established luxury housing markets, even as branded residences expand into additional cities.
Fashion TV tops the brand rankings
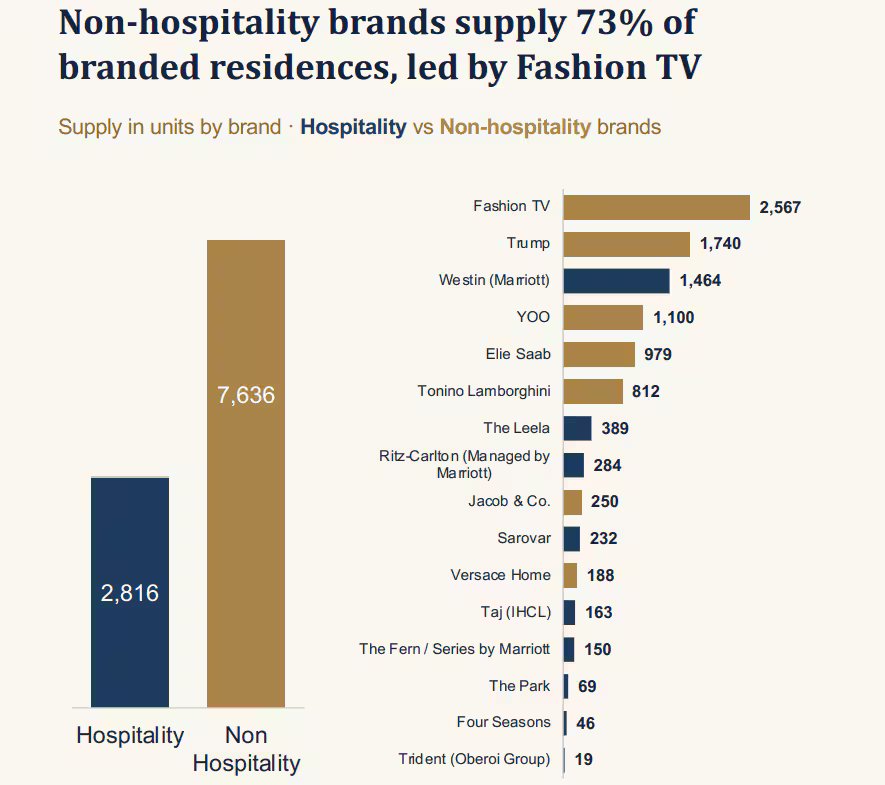
Non-hospitality brands accounted for 73% of India’s branded-residence supply, or 7,636 units, compared with 2,816 units associated with hospitality brands.
Fashion TV led the overall rankings with 2,567 units, accounting for roughly a quarter of total supply. Trump followed with 1,740 units, while Westin, associated with Marriott, accounted for 1,464 units.
Three- and four-bedroom homes dominate
Larger homes account for most of the supply in India’s branded-residence market. Three-bedroom and four-bedroom-plus configurations together represented 82% of the 10,452 units covered by the report.
Four-bedroom-plus residences formed the largest category, accounting for 43% of supply, followed by three-bedroom homes at 38%. Two-bedroom units represented 14%, while studios and one-bedroom homes together accounted for just 5%.
South India had the largest average carpet areas across configurations. Four-bedroom-plus homes in the region averaged approximately 3,709 sq ft, while three-bedroom units averaged 2,269 sq ft.
In North India, the average carpet area was 1,742 sq ft for three-bedroom homes and 2,926 sq ft for four-bedroom-plus residences. In the West, three-bedroom homes averaged 1,180 sq ft, while four-bedroom-plus units averaged 3,674 sq ft.
The data suggests that branded residences are primarily positioned for buyers seeking larger homes, although unit sizes and configurations vary by region.
Ten developers account for 78% of supply
The market is concentrated among a relatively small group of developers. The 10 largest developers in the report accounted for 8,177 units, or 78% of total supply.
M3M India/Smartworld led with 1,647 units, equivalent to 16% of the market. Whiteland Corporation followed with 1,464 units, while Tribeca Developers accounted for 984 units. Together, the top three developers represented 39% of total supply.
Other developers in the top 10 were Nahar Group, Signature Global, BramhaCorp, Merlin Group, DN Homes, Lodha Group and Panchshil Realty.
The concentration indicates that a limited number of developers are responsible for a substantial share of the segment’s expansion.
India leads Asia-Pacific by market value
India ranked first in the Asia-Pacific region by branded-residence market value at $9.7 billion, ahead of Vietnam at $8 billion and Thailand at $6.3 billion, according to CRE Matrix.
However, India ranked fourth by supply, with approximately 10,450 units in the report’s year-to-date comparison. Vietnam led with 15,800 units, followed by Thailand with 13,900 and the Philippines with 12,300.
India accounted for 21% of the region’s reported $45.3 billion market value, despite representing 15% of its units. The average reported value per Indian unit was $930,000, around 1.8 times Vietnam’s $510,000.