Home Sellers Now Outnumber Buyers By Record 63%
- House hunters had more negotiating power in September than they’ve had since the housing market crashed after the 2008 financial crisis, with 63% more home sellers than buyers.
- The number of buyers in the market dipped to the lowest level in records dating back to 2013, while the number of sellers rose to its highest level since 2020.
- 41 of the 50 most populous U.S. metro areas are buyer’s markets, the most in our records, led by Miami, Nashville and Houston.
- There are just 5 seller’s markets: San Francisco, and a few Northeast metros.
Homebuyers have more negotiating power than they’ve had since the housing market crashed in the aftermath of the Great Recession. There were an estimated 62.6% more home sellers than buyers in the U.S. housing market in September, the biggest gap in records dating back to 2013.
That marks the fourth record-breaking month in a row, and the margin is up sharply from 56.9% in August. The Sun Belt is driving the extreme buyer’s market nationwide; led by huge seller surpluses in Miami, Nashville, TN, and a handful of Texas metros.
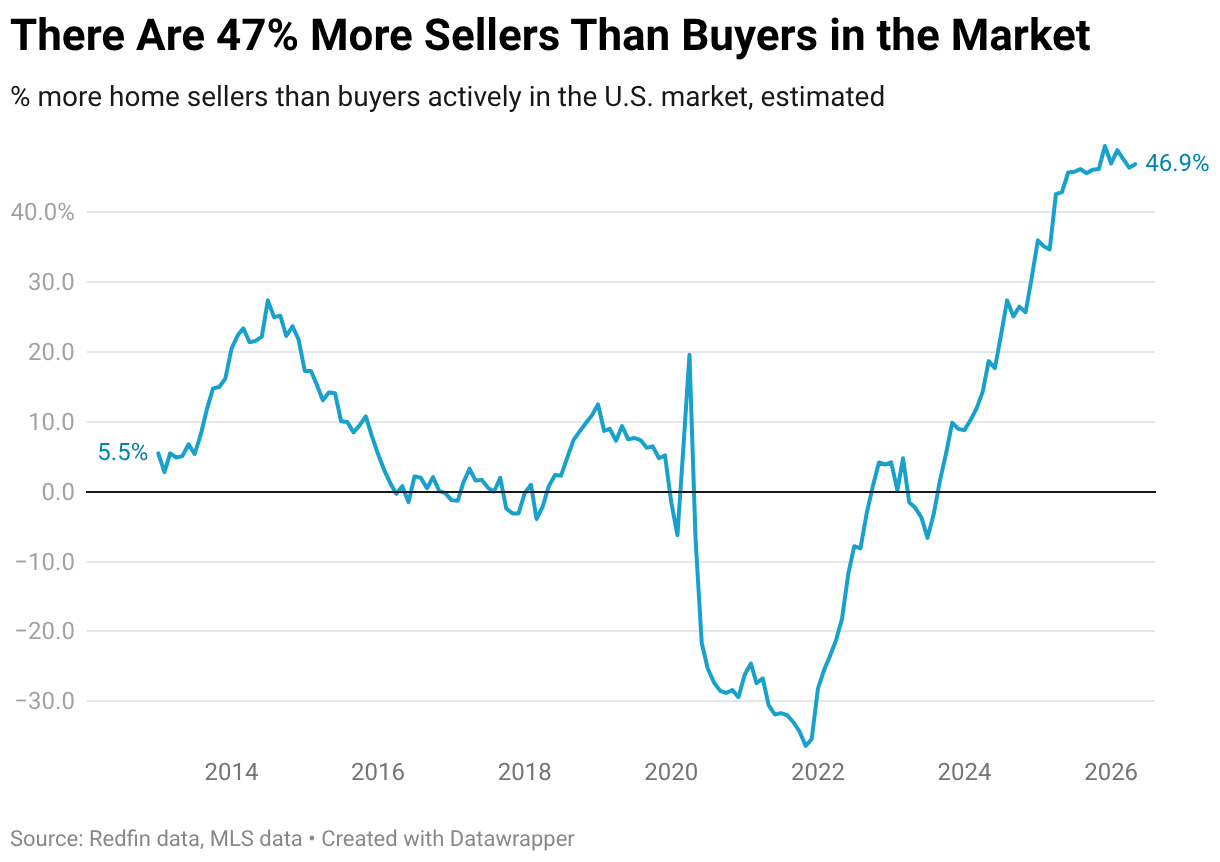
When sellers outnumber buyers, buyers typically have more negotiating power because they have options. That’s why a market with a lot more sellers than buyers is considered a buyer’s market. We define a market where there are over 10% more sellers than buyers as a buyer’s market and a market where there are over 10% fewer sellers than buyers as a seller’s market. A market where the gap is plus or minus 10% is considered a balanced market.
We estimated the number of buyers using proprietary Redfin data on the typical time from a buyer’s first tour to close of purchase, and MLS data on active listings and pending sales. The estimated number of sellers in the market is simply the number of active listings in the MLS. These estimates are seasonally adjusted and subject to revision. See a more detailed methodology here and view an interactive dashboard here.
It’s only a buyer’s market for people who can afford to buy. High housing costs and widespread economic uncertainty have caused many would-be buyers to back off in recent years, creating the imbalance of buyers and sellers we see today.
“This is a buyer’s market born out of caution, not strength,” said Asad Khan, a senior economist at Redfin. “Buyers have tremendous negotiating power in most of the country because so many other would-be buyers have been priced out of the market, or scared off by economic uncertainty. For house hunters who have the budget and job security to purchase a home in today’s market, that creates a unique opportunity: They can be picky, negotiate and even walk away if the deal doesn’t make sense financially or they find something they like better. The irony is that in terms of supply, these are some of the best conditions for buyers in many years–but they have arrived at a time when costs are so high that fewer people can afford to take advantage of them.”
Homebuyer Count Drops to Lowest Level on Record, Driving Gap Between Sellers and Buyers
The gap between buyers and sellers widened in September because buyers pulled back, while sellers kept showing up.
There were an estimated 928,892 homebuyers in the market nationwide in September, the lowest level in records dating back through 2013. That’s down 2.4% from a month earlier, the fifth straight monthly decline.
On the flip side, there were an estimated 1,510,784 home sellers in the market, the most since March 2020. That’s up 1.2% month over month.
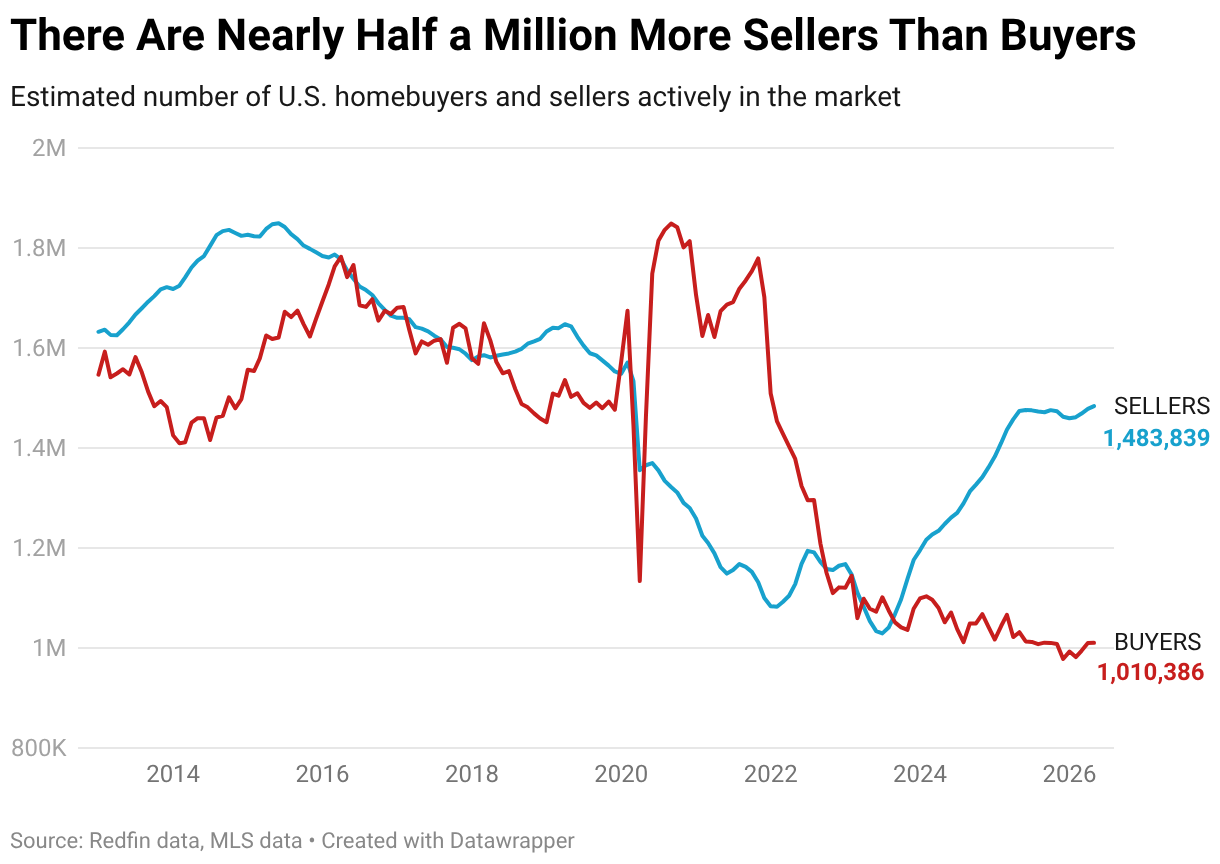
The number of homes on the market is rising largely because many homes are lingering without finding buyers. That builds up a big pool of listings, and each month, new listings add to that pool.
Homeowners have continued listing despite falling demand because many have simply given up waiting. After years on the sidelines hoping rates would drop or demand would rebound, some sellers see little reason to keep waiting, especially with prices still elevated enough to sell at a gain. Some homeowners are choosing to sell now because they’re concerned prices could drop if they wait longer. Others are listing out of necessity: new jobs, growing families, divorce or retirement, for example. But note that many homeowners who don’t need to move may decide not to list, or pull their homes off the market: Many have substantial equity, and the relatively strong job market means there’s typically not much pressure to sell.
Buyers Have More Negotiating Power in Miami Than Anywhere Else in the Country
Over 80% of U.S. metro areas—41 of the 50 U.S. metro areas Redfin analyzed—are buyer’s markets. That’s the most in records dating back through 2013.
For the second month in a row, Miami, Nashville and Houston have the biggest surpluses of sellers over buyers. In the top 13 buyer’s markets, there were more than twice as many sellers as buyers in September. All of them are located in the Sun Belt; four are in Texas and four are in Florida.
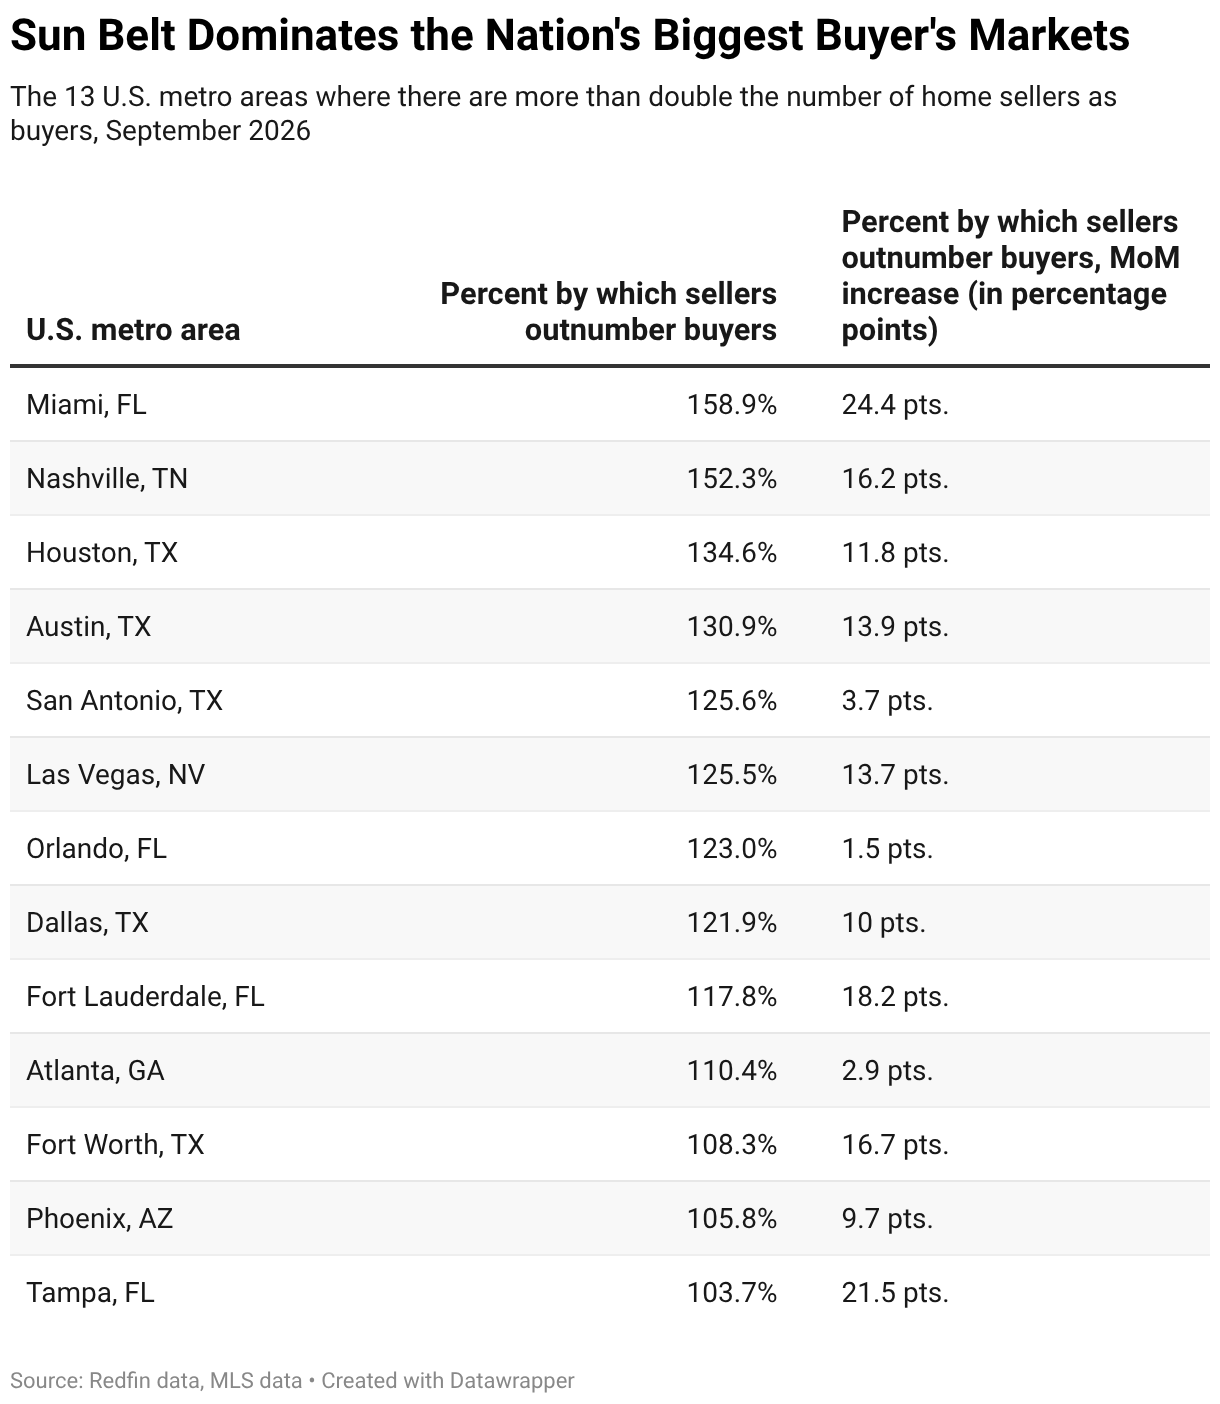
The Sun Belt—particularly Texas and Florida—is home to some of the nation’s biggest buyer’s markets partly because homebuilding has been so robust. Builders continue to add newly constructed homes even as buyer demand has cooled, contributing to a buildup of inventory and giving buyers more options and negotiating power.
Demand has cooled largely because buyers are increasingly priced out, with mortgage rates rising and home prices holding up. And in Florida, other costs associated with homebuying are rising, too, including HOA and insurance fees.
Four metros were “balanced” in September—neither buyer’s nor seller’s markets. Two New England metros are trending toward becoming buyer’s markets: Boston, where sellers outnumbered buyers by 7.4% after being roughly even the month before, and Providence, RI, where sellers outnumbered buyers by 2.4%, a reversal from the prior month, when there were 7.4% fewer sellers than buyers.
In Nearly All the Buyer’s Markets, Buyers Got Even More Power
The surplus of home sellers over buyers grew month over month in all but two of the buyer’s markets in the nation in September.
The surplus increased most in Miami, which also has the biggest surplus of sellers over buyers; there were 158.9% more sellers than buyers in September, up from 134.5% the month before. The next-biggest monthly increase was in Tampa, where there were 103.7% more sellers than buyers in September, up from 82.2% in August. Warren, MI rounds out the top three (47.1% more sellers than buyers, up from 27.3%).
“Sometimes, when buyer demand drops, seller activity drops right along with it—so the overall balance of power barely budges,” Khan said. “But that’s not what we’re seeing this month. In every single metro where the number of buyers fell from the month before, the gap between sellers and buyers increased, causing the market to tilt further in buyers’ favor. That’s because sellers didn’t pull back nearly as fast, or pull back at all.”
House hunters lost negotiating power in just two buyer’s markets. The surplus of sellers over buyers fell from August to September in St. Louis and Detroit, both of which are tilted in buyers’ favor, but not nearly as much as the Sun Belt metros. In Detroit, there were 37.9% more sellers than buyers in September, down from 46.5% the month before. In St. Louis, it was 24.5%, down from 26.9%.
There Are Just 5 Seller’s Markets, Including New York City Suburbs and San Francisco
Just five of the major U.S. metro areas Redfin analyzed were seller’s markets in September.
Nassau County, NY was the number-one seller’s market, with 28.6% fewer sellers than buyers. The other seller’s markets were Montgomery County, PA (-22.7%), Newark, NJ (-18.5%), Milwaukee (-16.1%) and San Francisco (-10.6%). That’s the second month in a row those five were the only seller’s markets in the nation.
The seller’s markets are concentrated in places where limited homebuilding has kept housing supply tight. In the greater New York City area, years of constrained construction, combined with strong demand for homes near a major job center, have left buyers competing for relatively few listings. San Francisco is an exception: The housing market has heated up as the AI boom creates wealth, fueling an increase in home sales and competition among buyers.
Home-sale prices rose an average of 6.4% year over year across the five seller’s markets in August. That’s compared with a 1% uptick across all of the buyer’s markets—a sign that in seller’s markets, competition among buyers is pushing up home prices.
| Metro-Level Summary: 50 Most Populous U.S. Metros
September 2026 |
||||
| U.S. metro area | Balance of power | Percent by which sellers outnumber buyers | Buyers | Sellers |
| Anaheim, CA | Buyer’s Market | 31.6% | 5,709 | 7,513 |
| Atlanta, GA | Buyer’s Market | 110.4% | 19,706 | 41,453 |
| Austin, TX | Buyer’s Market | 130.9% | 7,834 | 18,087 |
| Baltimore, MD | Buyer’s Market | 15.1% | 9,732 | 11,200 |
| Boston, MA | Balanced Market | 7.4% | 11,946 | 12,830 |
| Charlotte, NC | Buyer’s Market | 81.6% | 9,632 | 17,495 |
| Chicago, IL | Balanced Market | 6.5% | 24,441 | 26,038 |
| Cincinnati, OH | Buyer’s Market | 51.9% | 5,898 | 8,961 |
| Cleveland, OH | Buyer’s Market | 18.5% | 6,475 | 7,674 |
| Columbus, OH | Buyer’s Market | 51.3% | 6,106 | 9,240 |
| Dallas, TX | Buyer’s Market | 121.9% | 14,150 | 31,400 |
| Denver, CO | Buyer’s Market | 67.9% | 9,842 | 16,529 |
| Detroit, MI | Buyer’s Market | 37.9% | 5,152 | 7,102 |
| Fort Lauderdale, FL | Buyer’s Market | 117.8% | 8,172 | 17,800 |
| Fort Worth, TX | Buyer’s Market | 108.3% | 6,023 | 12,543 |
| Houston, TX | Buyer’s Market | 134.6% | 20,230 | 47,456 |
| Indianapolis, IN | Buyer’s Market | 38.9% | 7,352 | 10,212 |
| Jacksonville, FL | Buyer’s Market | 80.2% | 6,736 | 12,142 |
| Kansas City, MO | Buyer’s Market | 22.6% | 7,302 | 8,952 |
| Las Vegas, NV | Buyer’s Market | 125.5% | 6,313 | 14,234 |
| Los Angeles, CA | Buyer’s Market | 72.9% | 13,282 | 22,967 |
| Miami, FL | Buyer’s Market | 158.9% | 7,304 | 18,909 |
| Milwaukee, WI | Seller’s Market | -16.1% | 6,352 | 5,327 |
| Minneapolis, MN | Buyer’s Market | 26.5% | 11,904 | 15,057 |
| Montgomery County, PA | Seller’s Market | -22.7% | 7,218 | 5,583 |
| Nashville, TN | Buyer’s Market | 152.3% | 7,161 | 18,068 |
| Nassau County, NY | Seller’s Market | -28.6% | 11,120 | 7,935 |
| New Brunswick, NJ | Balanced Market | -0.6% | 9,798 | 9,737 |
| New York, NY | Buyer’s Market | 17.6% | 25,206 | 29,645 |
| Newark, NJ | Seller’s Market | -18.5% | 8,036 | 6,551 |
| Oakland, CA | Buyer’s Market | 26.9% | 4,550 | 5,773 |
| Orlando, FL | Buyer’s Market | 123.0% | 9,005 | 20,083 |
| Philadelphia, PA | Buyer’s Market | 56.4% | 5,825 | 9,112 |
| Phoenix, AZ | Buyer’s Market | 105.8% | 15,243 | 31,376 |
| Pittsburgh, PA | Buyer’s Market | 61.6% | 6,269 | 10,130 |
| Portland, OR | Buyer’s Market | 58.3% | 7,026 | 11,123 |
| Providence, RI | Balanced Market | 2.4% | 4,635 | 4,748 |
| Riverside, CA | Buyer’s Market | 81.1% | 10,457 | 18,935 |
| Sacramento, CA | Buyer’s Market | 43.2% | 5,309 | 7,603 |
| San Antonio, TX | Buyer’s Market | 125.6% | 8,495 | 19,165 |
| San Diego, CA | Buyer’s Market | 36.3% | 5,899 | 8,043 |
| San Francisco, CA | Seller’s Market | -10.6% | 2,658 | 2,378 |
| San Jose, CA | Buyer’s Market | 12.8% | 2,944 | 3,321 |
| Seattle, WA | Buyer’s Market | 84.1% | 6,525 | 12,014 |
| St. Louis, MO | Buyer’s Market | 24.5% | 8,813 | 10,970 |
| Tampa, FL | Buyer’s Market | 103.7% | 13,134 | 26,749 |
| Virginia Beach, VA | Buyer’s Market | 28.9% | 6,460 | 8,329 |
| Warren, MI | Buyer’s Market | 47.1% | 6,844 | 10,069 |
| Washington, DC | Buyer’s Market | 38.9% | 14,580 | 20,258 |
| West Palm Beach, FL | Buyer’s Market | 67.8% | 8,852 | 14,850 |