Why Broker Ad Testing Needs to Look Beyond Cheap Leads
What happens when brokers spend tens of thousands of dollars on Meta ads without a proper system for testing their creatives?
In the broker accounts we manage in Malaysia, a Meta budget typically runs at $50,000–70,000 a month. A broker without a proper testing system can launch 40–60 new creatives against that budget. At $60,000 and 50 creatives, each creative gets around $1,200. At a cost of $9–10 per lead, that generates roughly 130 leads per creative. Of those, 40–55% confirm their phone number and email within seven days. At the lower end of the 2.1–3.2% lead-to-deposit range, which is typical for a cost-per-lead account, that works out to around 2.8 first deposits per creative.
London’s trading industry is coming home!
Decisions are taken on day 3 to day 5, on the cost per lead.
The
volume is right; in our accounts, it came first, and it built the pool of
creatives that carry the deposits today. What is missing is a read: none of the
50 reaches a decision at the level of a first deposit, so the account drifts
towards the cheapest leads , which are the ones that never deposit.
Judging by the cost per lead is rational on day 5: the spread
between the best and the worst creative runs 2–3x and is visible within a week,
while for deposits, an ad set carrying 5 creatives collects about 14 a month.
The
cheapest leads come from income and urgency hooks; a platform walkthrough with
a real face and a risk warning on screen looks expensive next to them, $10 a
lead against $7.50, and gets paused. Table 1 shows 6 creatives of the kind that
appear in a Malaysian broker account.
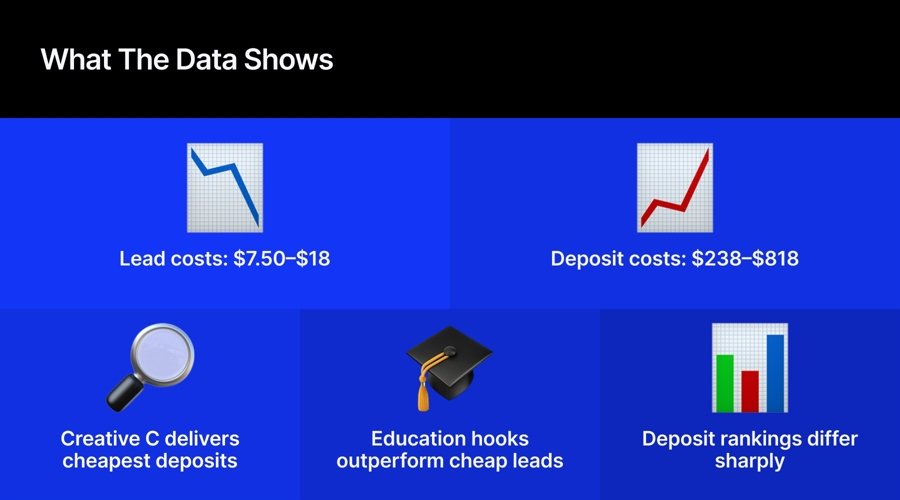
Cost per lead runs from $7.50 to $18, a
2.4x spread; cost per first deposit runs from $238 to $818, a 3.4x spread, and
across accounts that spread lands between 3x and 5x.
|
6 creatives, equal spend, Malaysia (midpoints) |
Cost per lead |
Lead-to-verified, 7 days |
Cost per verified lead |
Lead-to-deposit, 30 days |
Cost per first deposit |
|
A. |
$7.50 |
32% |
$23 |
1.3% |
$577 |
|
B. |
$8.50 |
40% |
$21 |
1.8% |
$472 |
|
C. |
$10.00 |
60% |
$17 |
4.2% |
$238 |
|
D. |
$12.00 |
55% |
$22 |
3.6% |
$333 |
|
E. |
$14.50 |
57% |
$25 |
3.9% |
$372 |
|
F. |
$18.00 |
42% |
$43 |
2.2% |
$818 |
The cheap-lead ranking shares 1 creative with the deposit ranking, so 2
of the 3 the dashboard promotes fall out. The verified-lead ranking, readable
on day 7, shares 2; the one it misses, the education hook, is what gate 2
exists for.
Put a decision rule on the same $60,000: a cost-per-lead rule
scales A and B; a cost-per-deposit rule puts about 70% of spend on C, D and E.
The first reports a blended cost per lead 15% lower, $9.30 against $10.90. It
also pays $433 per first deposit against $343, 26% more, and delivers 138
deposits a month against 175. Both columns are true at once; only the first is
on the dashboard by day 5.
The Structural Cause: The Conversion Event Is Too Rare
The event a broker needs to count is rare and slow. A
verified lead is frequent, about 40 per creative in its first week at gate-1
spend, while $1,200 at $433 per first deposit buys 2.8 of the event that
matters. A read at the level of the variable needs 15–20 deposits in the cell,
and the relative error at 17.5 deposits is still about 24%.
It is also slow:
25–40% of first deposits land outside Meta’s 7-day click window, so a fair read
waits for the 30-day window. Add 1–2 working weeks of compliance and platform
pre-approval, and an ad-level read takes 6–7 weeks from brief to verdict. A
creative at these budgets fatigues in 3–6 weeks, so the verdict arrives after
the creative it was meant to judge has been retired.
A first deposit is too rare an event to judge an ad by, so
the only unit a broker can learn from is the variable.
The rule is about frequency: anything that happens 3 times a
month per creative has to be pooled before it can be read. Six ads that share a
hook deliver 2–3 deposits each and 12–18 together, and the hook cell closes
inside 4–6 weeks.
Every creative is tagged on 4 dimensions before it spends:
hook, angle, format, and offer. In our accounts, the hook explains most of the
spread in cost per first deposit, then angle, format, and offer.
How We Got Here
We got here by doing the volume first. The creative count in
our accounts went up before any system existed, and volume on its own produced
2 things: a handful of creatives that visibly generated deposits, and no way to
say why. When they fatigued, we could not reproduce them; the next 50 were
guesses again, and cost per deposit drifted back up within 2 months.
Tags and
gates came later, to turn a lucky pool into a repeatable one: once every
creative carried its hook, angle, format and offer, the pool became a list of
variables, and a variable can be re-executed on purpose.
The last lesson took
longest: a pool depletes at the rate creatives fatigue, and testing is the flow
that refills it. The month we slowed the hypothesis track because the pool
looked strong was the month cost per deposit started climbing again.
The System: Two Gates, One Taxonomy, Every Ad Tagged
Gate 1 is an ad-level lead gate. Every new creative
runs at $150–200 a day until it has 80–100 leads, which at $7–15 a lead costs
$560–1,500 and takes 5–7 days. At the gate, it is judged on one number, cost
per verified lead against the account median, and the bottom half goes.
Gate 2 is a variable-level deposit gate, and it runs
inside production. Survivors move into the main campaigns, tagged, and
every hook, angle, format and offer accumulates leads, verified leads, 30-day
deposits and cost per first deposit across all the ads that carry it. A cell
closes at 15–20 first deposits, $6,000–8,000 of attributed spend. A variable
beats the control when its cost per first deposit comes in 25% or more below
the control’s over a closed read; anything closer stays open.
The third part is cadence, and it keeps the volume.
The 40–60 creatives a month are split into 2 tracks, both tagged. Track 1 is 15–20
new hypotheses, each written against an open cell and batched through
compliance; at the 90-lead gate, they cost about $17,000 a month, 29% of a
$60,000 budget. Track 2 is 25–40 executions of proven variables, which skip
gate 1, run on the remaining 71%, and keep the pool from fatiguing.
The most common way this gets built wrong is a sealed
testing campaign with its own budget. A 28% test budget at $60,000 buys about
42 first deposits a month, 2 or 3 closed cells, and, at a 15–25% variable-level
win rate, that is 0.5 winners a month; a control fatigues in 3–6 weeks, so the
account needs about 1. Tagging every production ad closes the gap: 175 deposits
a month close about 10 cells and produce 2 winners.
A Malaysian Broker, 3 Months
What follows is a composite drawn from the accounts we
manage, with the model run at the inputs those accounts show; the figures are
illustrative at the inputs we observe. The broker spent $60,000 a month on Meta
in Malaysia and launched around 50 creatives a month: blended cost per lead
$9.30, more than 6,400 leads, about 138 first deposits at $433 each.
Month 1
changed nothing on the deposit line; every creative was tagged, gate 1 was
switched on, and the first verified-lead read arrived on day 8, income-hook
leads confirming at about 32% against 60% for the walkthrough. Month 2 closed
the first hook-level deposit read: the income family, 35% of spend under the
old rule, came in at about $580 per first deposit against $238 for the
walkthrough.
Month 3, the right-hand column of Table 3: the same 50 creatives,
18 of them against open hypotheses and about 30 as executions of proven
variables; cost per lead up 17%, cost per first deposit down 21%, 175 deposits
against 138. The last row is the one to put on the wall: the share of spend on
a variable with a closed read, 0% before, about 70% by month 3. That 70% is the
pool.
|
Composite Malaysia broker, per month |
Before |
Month 3 |
|
Meta |
$60,000 |
$60,000 |
|
New |
~50 |
~50 |
|
New |
0 |
18 |
|
New |
0 |
~30 |
|
Blended |
$9.30 |
$10.90 |
|
Cost |
~$22.60 |
~$21.50 |
|
Lead-to-deposit, |
2.14% |
3.19% |
|
Cost |
~$433 |
~$343 |
|
First |
~138 |
~175 |
|
Spend |
0% |
~70% |
The pool did not hold on its own: of the 5 values it held in
month 3, 2 had fatigued by month 5, and the hypothesis track replaced them. A
pool that stops being fed is 6 weeks from being an income hook again.
What to Measure Instead
The scorecard has one row per variable value, with every ad
that carries it rolled up: leads and their cost, verified leads within 7 days
and their cost, first deposits within 30 days and their cost, the share of
deposits outside the 7-day click window, and the read status of the cell.
Above
it sit 2 health metrics: win rate per variable, which should hold at 15–25%,
and win rate per ad, 5–10%, which shows whether executions keep pace with
hypotheses.
A broker that runs 50 creatives a month and judges them on day 5 is
running an experiment with no control group and a sample of 3. The same volume,
tagged, read at the variable and never paused, is a pool that pays for itself
and a pipeline that keeps it full.
What happens when brokers spend tens of thousands of dollars on Meta ads without a proper system for testing their creatives?
In the broker accounts we manage in Malaysia, a Meta budget typically runs at $50,000–70,000 a month. A broker without a proper testing system can launch 40–60 new creatives against that budget. At $60,000 and 50 creatives, each creative gets around $1,200. At a cost of $9–10 per lead, that generates roughly 130 leads per creative. Of those, 40–55% confirm their phone number and email within seven days. At the lower end of the 2.1–3.2% lead-to-deposit range, which is typical for a cost-per-lead account, that works out to around 2.8 first deposits per creative.
London’s trading industry is coming home!
Decisions are taken on day 3 to day 5, on the cost per lead.
The
volume is right; in our accounts, it came first, and it built the pool of
creatives that carry the deposits today. What is missing is a read: none of the
50 reaches a decision at the level of a first deposit, so the account drifts
towards the cheapest leads , which are the ones that never deposit.
Judging by the cost per lead is rational on day 5: the spread
between the best and the worst creative runs 2–3x and is visible within a week,
while for deposits, an ad set carrying 5 creatives collects about 14 a month.
The
cheapest leads come from income and urgency hooks; a platform walkthrough with
a real face and a risk warning on screen looks expensive next to them, $10 a
lead against $7.50, and gets paused. Table 1 shows 6 creatives of the kind that
appear in a Malaysian broker account.
Cost per lead runs from $7.50 to $18, a
2.4x spread; cost per first deposit runs from $238 to $818, a 3.4x spread, and
across accounts that spread lands between 3x and 5x.
|
6 creatives, equal spend, Malaysia (midpoints) |
Cost per lead |
Lead-to-verified, 7 days |
Cost per verified lead |
Lead-to-deposit, 30 days |
Cost per first deposit |
|
A. |
$7.50 |
32% |
$23 |
1.3% |
$577 |
|
B. |
$8.50 |
40% |
$21 |
1.8% |
$472 |
|
C. |
$10.00 |
60% |
$17 |
4.2% |
$238 |
|
D. |
$12.00 |
55% |
$22 |
3.6% |
$333 |
|
E. |
$14.50 |
57% |
$25 |
3.9% |
$372 |
|
F. |
$18.00 |
42% |
$43 |
2.2% |
$818 |
The cheap-lead ranking shares 1 creative with the deposit ranking, so 2
of the 3 the dashboard promotes fall out. The verified-lead ranking, readable
on day 7, shares 2; the one it misses, the education hook, is what gate 2
exists for.
Put a decision rule on the same $60,000: a cost-per-lead rule
scales A and B; a cost-per-deposit rule puts about 70% of spend on C, D and E.
The first reports a blended cost per lead 15% lower, $9.30 against $10.90. It
also pays $433 per first deposit against $343, 26% more, and delivers 138
deposits a month against 175. Both columns are true at once; only the first is
on the dashboard by day 5.
The Structural Cause: The Conversion Event Is Too Rare
The event a broker needs to count is rare and slow. A
verified lead is frequent, about 40 per creative in its first week at gate-1
spend, while $1,200 at $433 per first deposit buys 2.8 of the event that
matters. A read at the level of the variable needs 15–20 deposits in the cell,
and the relative error at 17.5 deposits is still about 24%.
It is also slow:
25–40% of first deposits land outside Meta’s 7-day click window, so a fair read
waits for the 30-day window. Add 1–2 working weeks of compliance and platform
pre-approval, and an ad-level read takes 6–7 weeks from brief to verdict. A
creative at these budgets fatigues in 3–6 weeks, so the verdict arrives after
the creative it was meant to judge has been retired.
A first deposit is too rare an event to judge an ad by, so
the only unit a broker can learn from is the variable.
The rule is about frequency: anything that happens 3 times a
month per creative has to be pooled before it can be read. Six ads that share a
hook deliver 2–3 deposits each and 12–18 together, and the hook cell closes
inside 4–6 weeks.
Every creative is tagged on 4 dimensions before it spends:
hook, angle, format, and offer. In our accounts, the hook explains most of the
spread in cost per first deposit, then angle, format, and offer.
How We Got Here
We got here by doing the volume first. The creative count in
our accounts went up before any system existed, and volume on its own produced
2 things: a handful of creatives that visibly generated deposits, and no way to
say why. When they fatigued, we could not reproduce them; the next 50 were
guesses again, and cost per deposit drifted back up within 2 months.
Tags and
gates came later, to turn a lucky pool into a repeatable one: once every
creative carried its hook, angle, format and offer, the pool became a list of
variables, and a variable can be re-executed on purpose.
The last lesson took
longest: a pool depletes at the rate creatives fatigue, and testing is the flow
that refills it. The month we slowed the hypothesis track because the pool
looked strong was the month cost per deposit started climbing again.
The System: Two Gates, One Taxonomy, Every Ad Tagged
Gate 1 is an ad-level lead gate. Every new creative
runs at $150–200 a day until it has 80–100 leads, which at $7–15 a lead costs
$560–1,500 and takes 5–7 days. At the gate, it is judged on one number, cost
per verified lead against the account median, and the bottom half goes.
Gate 2 is a variable-level deposit gate, and it runs
inside production. Survivors move into the main campaigns, tagged, and
every hook, angle, format and offer accumulates leads, verified leads, 30-day
deposits and cost per first deposit across all the ads that carry it. A cell
closes at 15–20 first deposits, $6,000–8,000 of attributed spend. A variable
beats the control when its cost per first deposit comes in 25% or more below
the control’s over a closed read; anything closer stays open.
The third part is cadence, and it keeps the volume.
The 40–60 creatives a month are split into 2 tracks, both tagged. Track 1 is 15–20
new hypotheses, each written against an open cell and batched through
compliance; at the 90-lead gate, they cost about $17,000 a month, 29% of a
$60,000 budget. Track 2 is 25–40 executions of proven variables, which skip
gate 1, run on the remaining 71%, and keep the pool from fatiguing.
The most common way this gets built wrong is a sealed
testing campaign with its own budget. A 28% test budget at $60,000 buys about
42 first deposits a month, 2 or 3 closed cells, and, at a 15–25% variable-level
win rate, that is 0.5 winners a month; a control fatigues in 3–6 weeks, so the
account needs about 1. Tagging every production ad closes the gap: 175 deposits
a month close about 10 cells and produce 2 winners.
A Malaysian Broker, 3 Months
What follows is a composite drawn from the accounts we
manage, with the model run at the inputs those accounts show; the figures are
illustrative at the inputs we observe. The broker spent $60,000 a month on Meta
in Malaysia and launched around 50 creatives a month: blended cost per lead
$9.30, more than 6,400 leads, about 138 first deposits at $433 each.
Month 1
changed nothing on the deposit line; every creative was tagged, gate 1 was
switched on, and the first verified-lead read arrived on day 8, income-hook
leads confirming at about 32% against 60% for the walkthrough. Month 2 closed
the first hook-level deposit read: the income family, 35% of spend under the
old rule, came in at about $580 per first deposit against $238 for the
walkthrough.
Month 3, the right-hand column of Table 3: the same 50 creatives,
18 of them against open hypotheses and about 30 as executions of proven
variables; cost per lead up 17%, cost per first deposit down 21%, 175 deposits
against 138. The last row is the one to put on the wall: the share of spend on
a variable with a closed read, 0% before, about 70% by month 3. That 70% is the
pool.
|
Composite Malaysia broker, per month |
Before |
Month 3 |
|
Meta |
$60,000 |
$60,000 |
|
New |
~50 |
~50 |
|
New |
0 |
18 |
|
New |
0 |
~30 |
|
Blended |
$9.30 |
$10.90 |
|
Cost |
~$22.60 |
~$21.50 |
|
Lead-to-deposit, |
2.14% |
3.19% |
|
Cost |
~$433 |
~$343 |
|
First |
~138 |
~175 |
|
Spend |
0% |
~70% |
The pool did not hold on its own: of the 5 values it held in
month 3, 2 had fatigued by month 5, and the hypothesis track replaced them. A
pool that stops being fed is 6 weeks from being an income hook again.
What to Measure Instead
The scorecard has one row per variable value, with every ad
that carries it rolled up: leads and their cost, verified leads within 7 days
and their cost, first deposits within 30 days and their cost, the share of
deposits outside the 7-day click window, and the read status of the cell.
Above
it sit 2 health metrics: win rate per variable, which should hold at 15–25%,
and win rate per ad, 5–10%, which shows whether executions keep pace with
hypotheses.
A broker that runs 50 creatives a month and judges them on day 5 is
running an experiment with no control group and a sample of 3. The same volume,
tagged, read at the variable and never paused, is a pool that pays for itself
and a pipeline that keeps it full.