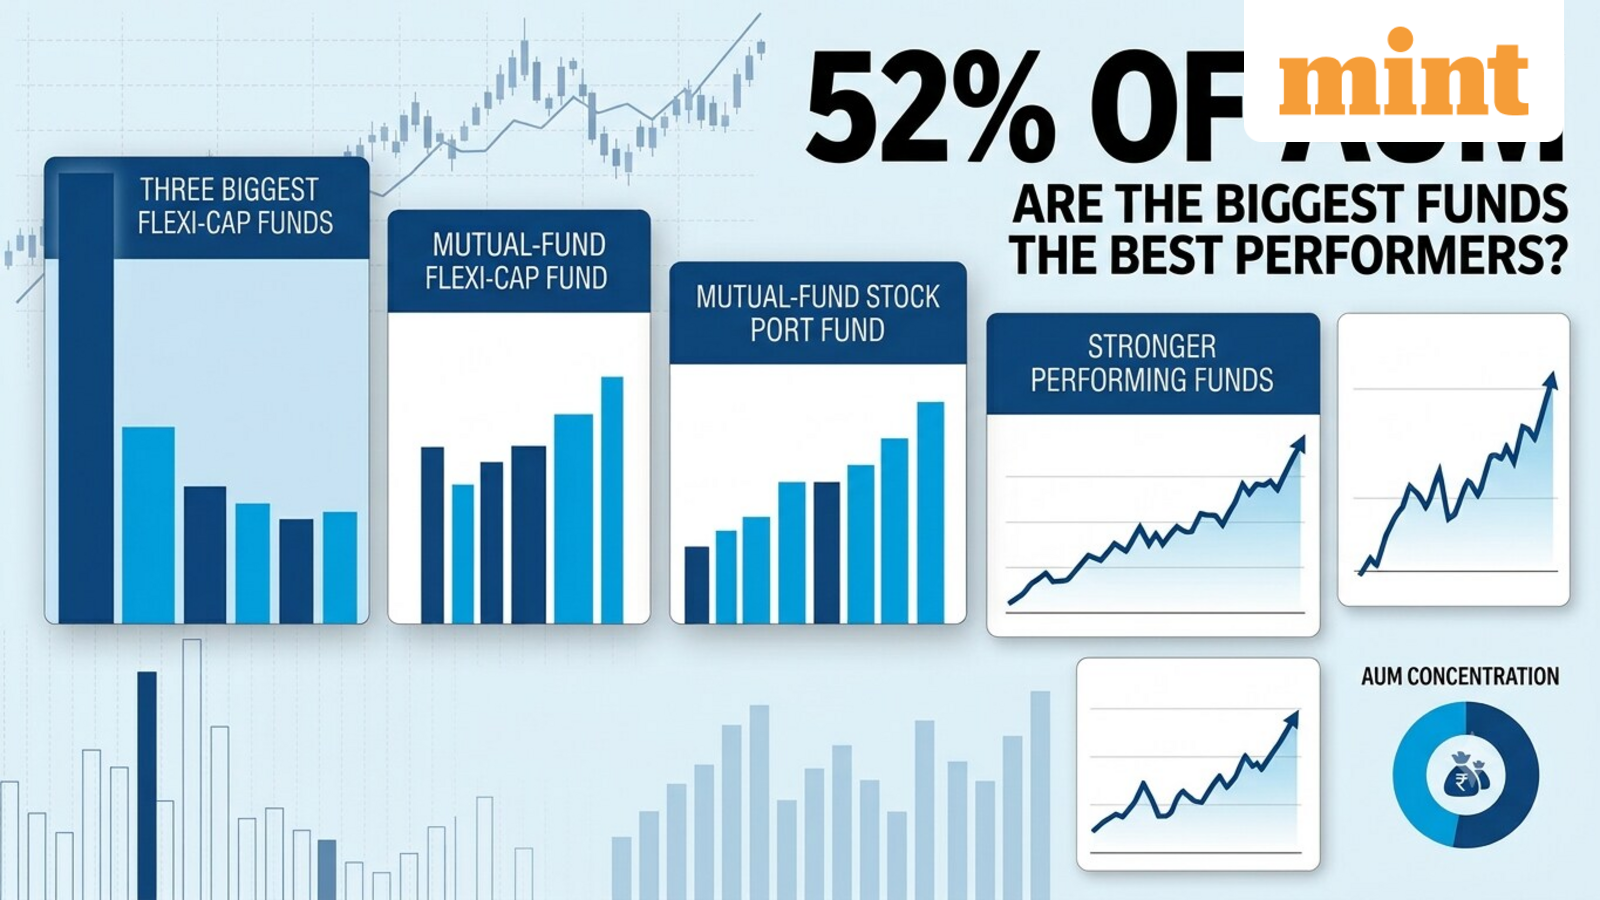
3 flexi-cap funds hold 52% of the category’s AUM: Are the biggest schemes also leading in performance?
Flexi-cap funds can invest across large-, mid- and small-cap stocks without being tied to a particular market-cap segment. But while the category has grown to 46 schemes, a large share of its assets is concentrated in just 3 funds.
According to the latest AMFI monthly data, flexi-cap funds had a combined AUM of ₹6,11,390 crore as of 31 August 2026.
Of this, Parag Parikh Flexi Cap, HDFC Flexi Cap, and Kotak Flexi Cap together managed ₹3,17,403 crore, or about 51.9% of the category’s total AUM.
Here’s how these 3 flexi-cap funds performed and what investors should know.
How have the top 3 flexi-cap funds performed?
| Flexi-cap funds | AUM ( ₹ crore) | Share of category AUM | 1-year return |
| Parag Parikh Flexi Cap | 1,47,405 | 24.11% | -4.04% |
| HDFC Flexi Cap | 1,13,606 | 18.58% | 1.86% |
| Kotak Flexi Cap | 56,392 | 9.22% | 0.10% |
| Combined | 3,17,403 | 51.91% | — |
*Source: Value Research, AUM as on 31 August 2026, Direct Plans, Returns as on 11 September 2026
The three largest schemes account for more than half of all flexi-cap assets (around 52% of total AUM), but none of them featured among the top performers over the one-year period based on the data provided.
Parag Parikh Flexi Cap, the largest fund in the category, with nearly a quarter of the category’s AUM, delivered a negative 4.04% return over one year. HDFC Flexi Cap returned 1.86%, while Kotak Flexi Cap delivered 0.10%.
For investors, the numbers show that category size and recent performance have not moved together.
Which flexi-cap funds delivered the highest one-year returns?
| Flexi-cap funds | AUM ( ₹ crore) | 1-year return |
| ITI Flexi Cap | 1,588 | 14.07% |
| Quant Flexi Cap | 7,364 | 13.72% |
| Bank of India Flexi Cap | 2,953 | 13.32% |
*Source: Value Research, AUM as on 31 August 2026, Direct Plans, Returns as on 11 September 2026
ITI Flexi Cap had an AUM of just ₹1,588 crore, equivalent to around 0.26% of the category’s total AUM, but delivered a 14.07% one-year return. That compares with a negative 4.04% return from Parag Parikh Flexi Cap despite the latter managing nearly 93 times as much money.
This highlights an important point for investors: a fund’s AUM is not a measure of its recent performance. Large AUM can reflect factors such as a longer track record, investor familiarity and sustained inflows, rather than superior returns in every period.
What happens over five years?
The longer-term numbers present a somewhat different picture. HDFC Flexi Cap, one of the three largest schemes, topped the chart with 17.47% returns in a five-year period. Bank of India Flexi Cap followed with 16.79%, while JM Flexi Cap delivered 15.74%.
In contrast, Parag Parikh Flexi Cap and Kotak Flexi Cap delivered 11.61% and 10.57%, respectively, over the same period based on the data provided.
For investors, this comparison shows why AUM alone should not be used to judge a flexi-cap fund.
The biggest schemes may dominate the category in terms of assets, but smaller funds have also delivered stronger returns over certain periods.
Therefore, investors need to look at performance across different time periods, along with consistency and the fund’s investment strategy, rather than assuming that the largest fund is necessarily the best performer.
Disclaimer: This is purely for educational/informational purposes and should not be taken as any sort of investment advice. Always consult a SEBI-registered advisor before making any investment decisions.