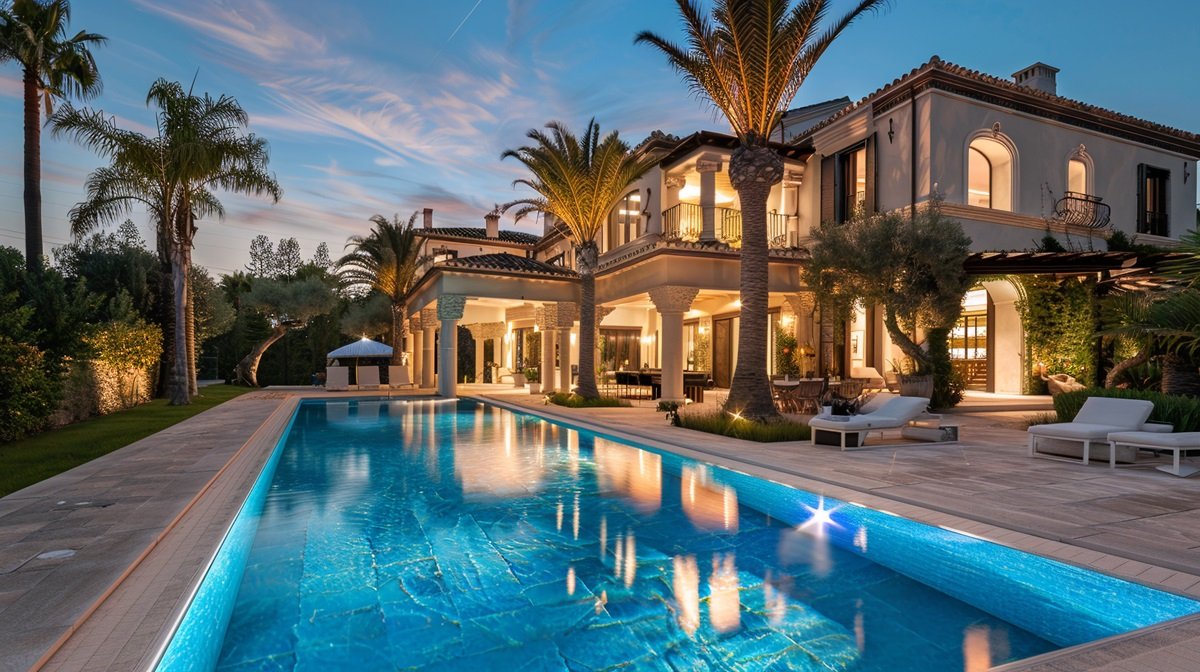
Regional Markets Shift as Luxury Threshold Continues to Decline
In July, the national entry point for luxury housing experienced a continued gradual adjustment, decreasing to $1,250,750, which is a 2.7% decline compared to the previous year. This marks the 29th consecutive month of annual decreases, as reported in the Realtor.com July Luxury Housing Report.
Although luxury price thresholds are easing on a national level, the data indicates that high-end markets are diverging in their trends, with some areas undergoing significant price adjustments while others are witnessing a tightening of inventory as homes are selling at a quicker pace.
Price reductions were observed across all luxury tiers. The national threshold for the top 5% of listings saw a year-over-year decrease of 1.2%, while the ultra-luxury threshold (top 1%) experienced a decline of 1.7%. Additionally, million-dollar listings constituted a slightly smaller portion of the market, making up 13.2% of active inventory in July.

Despite the lower luxury price thresholds, demand has remained robust. Luxury homes across all tiers sold more rapidly than they did a year prior, indicating that the softer pricing in numerous markets is influenced by changing inventory conditions as much as it is by shifts in buyer demand.
“The national luxury market continues to normalize, but the forces driving prices vary significantly from one market to another,” said Anthony Smith, Senior Economist at Realtor.com. “Some markets are undergoing broader price adjustments after several years of rapid appreciation, while others are seeing luxury inventory move quickly enough that available listings are shrinking.”
National Luxury Overview (July 2026):
| Pricing | July 2026 | Monthly Change | YoY Change |
| Luxury Threshold 90th Percentile | $1,250,750 | -2.1 % | -2.7 % |
| High-End Luxury Threshold 95th Percentile | $1,973,160 | -1.2 % | -1.2 % |
| Ultra Luxury Threshold 99th Percentile | $5,427,818 | -1.6 % | -1.7 % |
| Million-Dollar Listing Share | 13.2 % | -0.5pp | -0.6pp |
Regional Luxury Markets Taking Other Routes
Despite a 2.7% decrease in the national luxury threshold year over year, local markets exhibited significantly varied trends. In July, the Austin, Texas metro area experienced the steepest luxury price drop in the nation, with its luxury threshold decreasing by 9.6% year-over-year to $1,262,726, which is over three times the national average. The inventory of million-dollar listings in the metro area fell by 17.8%, and both the 95th and 99th percentile luxury thresholds also recorded annual declines.
Following closely were Boston and San Francisco, each reporting an 8.6% decline, albeit through different mechanisms. Boston’s inventory of million-dollar listings increased by 7.4% compared to the previous year, while San Francisco’s inventory decreased by 20.9%. However, San Francisco’s million-dollar homes sold at a median pace of just 37 days, the quickest among the luxury markets examined, indicating that inventory is being absorbed rather than accumulating.
Similarly, San Jose, CA, displayed a comparable trend. Although its luxury threshold fell by 6.9% year-over-year, nearly 62% of active listings are priced above $1 million, representing the highest concentration in the nation, and million-dollar homes sold at a median of just 38 days.
California represented four out of the 10 metropolitan regions experiencing the most significant declines in luxury prices, underscoring the extensive nature of price corrections throughout numerous high-end housing markets in the state.
Top 10 Metros with the Largest Annual Price Drops:
| Rank | Area | 10% Most Expensive Listings Start at: |
Top 10% Listings YoY |
Million-Dollar Listing Count YoY |
Median Days on Market – Million Dollar Listings |
| USA | $1,250,750 | -2.7 % | -2.0 % | 66 | |
| 1 | Austin-Round Rock- San Marcos, Texas |
$1,262,726 | -9.6 % | -17.8 % | 78 |
| 2 | Boston-Cambridge- Newton, MA-NH |
$2,485,340 | -8.6 % | 7.4 % | 53 |
| 3 | San Francisco-Oakland-Fremont, CA | $2,490,089 | -8.6 % | -20.9 % | 37 |
| 4 | San Diego-Chula Vista-Carlsbad, CA |
$2,766,487 | -7.3 % | -16.6 % | 46 |
| 5 | Washington-Arlington- Alexandria, DC-VA- MD-WV |
$1,406,428 | -7.0 % | 1.7 % | 45 |
| 6 | San Jose-Sunnyvale-Santa Clara, CA | $3,273,750 | -6.9 % | -1.6 % | 38 |
| 7 | Oxnard-Thousand Oaks-Ventura, CA |
$2,949,150 | -6.0 % | -11.2 % | 53 |
| 8 | Denver-Aurora-Centennial, CO | $1,269,259 | -5.9 % | -15.7 % | 57 |
| 9 | Charleston-North Charleston, SC |
$2,165,450 | -5.5 % | 1.6 % | 68 |
| 10 | Bridgeport-Stamford- Danbury, CT |
$4,130,000 | -5.5 % | -4.0 % | 51 |
“A lower luxury threshold doesn’t necessarily mean demand has weakened,” Smith said. “In some markets, declining thresholds reflect prices adjusting after rapid growth. In others, like San Francisco and San Jose, Calif., homes are selling so quickly that inventory is turning over faster than it’s being replenished. That’s why it’s important to look beyond prices to understand what’s happening in today’s luxury market.”
Despite luxury homes taking longer to sell in July compared to June, which is a typical seasonal trend, every segment of the luxury market continued to surpass last year’s performance.
Properties in the top 10% of the market were sold in a median time of 68 days, which is three days quicker than in July 2025. High-end luxury properties were sold in 76 days, also three days faster than the previous year, while ultra-luxury homes were sold in 91 days, showing an improvement of five days compared to a year ago.
These results indicate that the luxury market is continuing to stabilize from the pricing trends established during the pandemic, without a significant decline in buyer activity.
Top 10 Most Expensive Metropolitan Luxury Markets:
| Rank | Area | 10% Most Expensive Listings Start at: |
10% Most Expensive MoM |
10% Most Expensive YoY |
Average Annual Million-Dollar Listings Count |
Multiple to National Luxury Threshold |
| 1 | Bridgeport-Stamford- Danbury, CT |
$4,130,000 | -1.7 % | -5.5 % | 524 | 3.3 |
| 2 | Los Angeles-Long Beach-Anaheim, CA |
$3,997,157 | -2.5 % | -3.8 % | 9,208 | 3.2 |
| 3 | Kahului-Wailuku, Hawaii | $3,950,000 | 0.2 % | -0.8 % | 711 | 3.2 |
| 4 | Naples-Marco Island, FL |
$3,687,718 | -1.2 % | 5.5 % | 2,150 | 2.9 |
| 5 | San Jose-Sunnyvale-Santa Clara, CA | $3,273,750 | 0.8 % | -6.9 % | 1,066 | 2.6 |
| 6 | Oxnard-Thousand Oaks-Ventura, CA |
$2,949,150 | -1.6 % | -6.0 % | 637 | 2.4 |
| 7 | New York-Newark-Jersey City, NY-NJ | $2,851,904 | -3.8 % | -3.0 % | 11,488 | 2.3 |
| 8 | Crestview-Fort Walton Beach-Destin, FL |
$2,806,764 | -2.3 % | -2.6 % | 1,350 | 2.2 |
| 9 | San Diego-Chula Vista-Carlsbad, CA |
$2,766,487 | -1.8 % | -7.3 % | 2,249 | 2.2 |
| 10 | Atlantic City-Hammonton, NJ | $2,616,950 | 1.7 % | 4.8 % | 540 | 2.1 |
To read the full report, click here.