The Income Needed to Afford Typical American Home Holds Steady Near Record High of $110,000
- Housing costs keep rising, but so do incomes, leaving the income required to afford a home largely unchanged from last year’s record high.
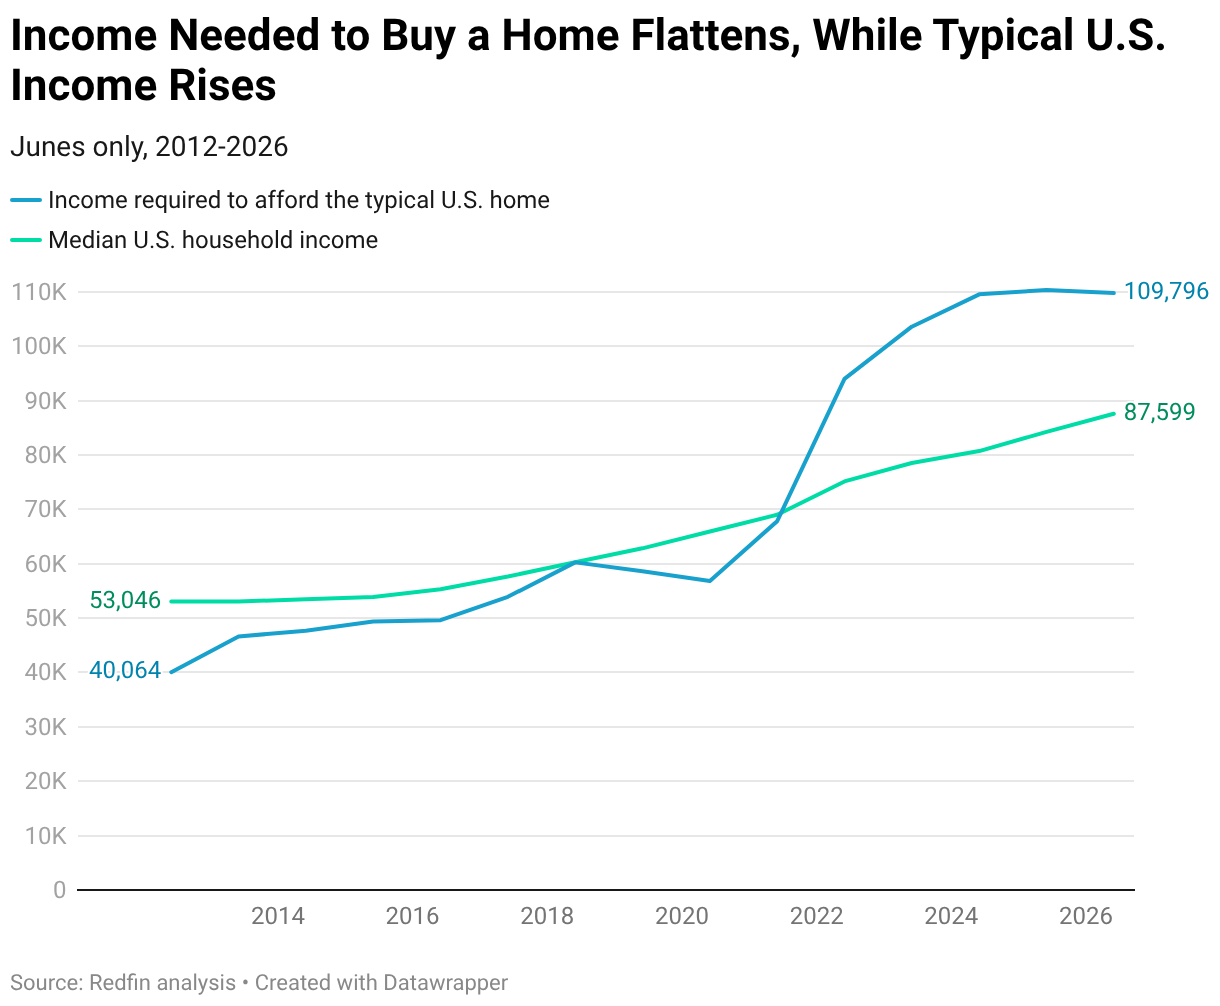
- The income needed to buy a home is roughly $22,000 above what the typical U.S. household earns. But the gap is shrinking: it was $26,000 a year ago, and $29,000 two years ago.
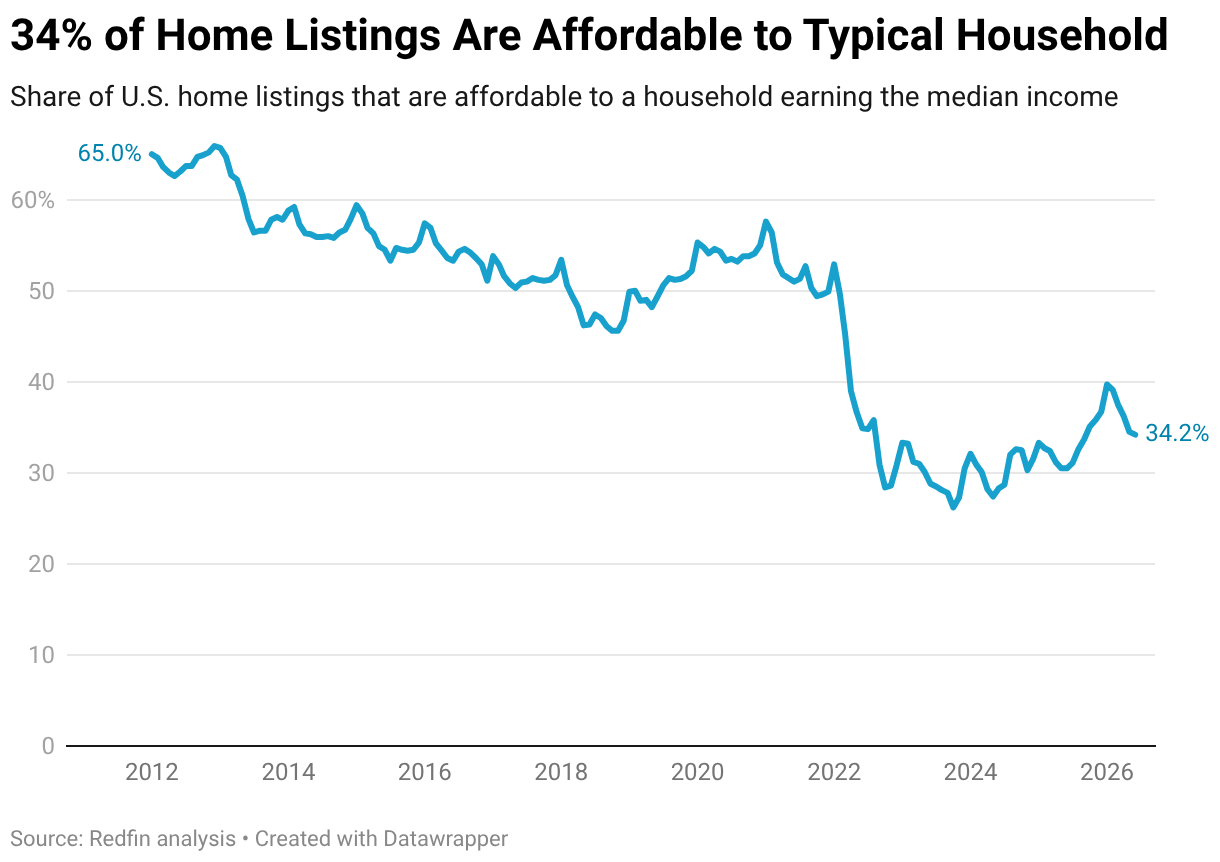
- The typical American would need to spend 38% of their income on the median-priced home, and 34% of U.S. listings are affordable to them.
- Homebuying is becoming more affordable in West Coast markets where prices are falling, like Seattle and San Jose, though homes are still much too expensive for average earners.
Americans need to earn $109,796 to afford the typical U.S. home for sale, down 0.5% from an all-time high of $110,382 a year ago.
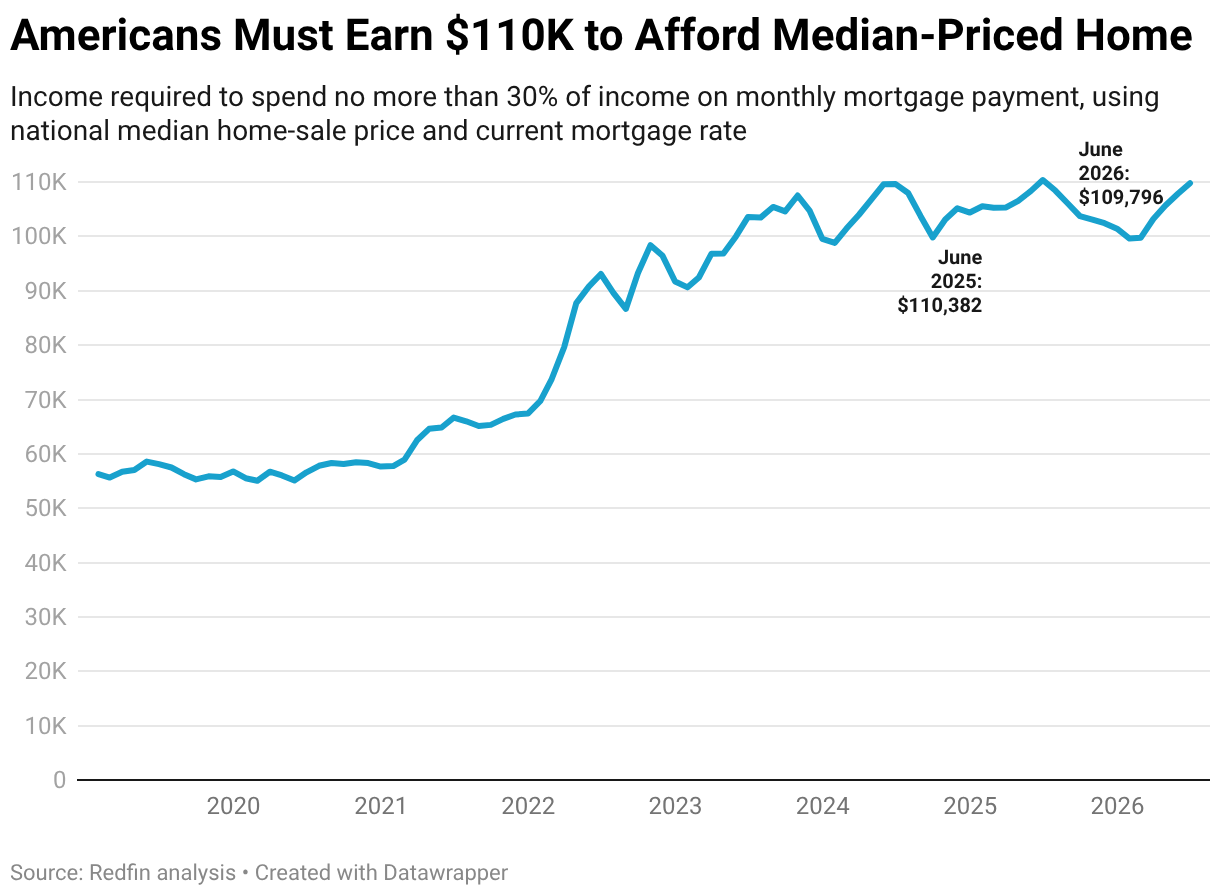
We consider a home affordable if a buyer taking out a mortgage would spend no more than 30% of their income on their monthly housing payment. This is based on a Redfin analysis of median home sale prices, prevailing mortgage rates and property-tax payments, and assumes a 15% down payment. This report focuses on June 2026—the most recent period for which data is available.
Homebuying affordability is essentially flat from a year ago because monthly housing costs are increasing–and incomes are increasing at a similar rate:
- The median U.S. home sale price rose 2.2% year over year in June, and the average mortgage rate came down slightly but was still elevated in the mid-6% range.
- The median household income was an estimated $87,599, up 4% year over year.
The income required to afford a home soared in 2022 and 2023: Home prices skyrocketed amid the pandemic homebuying frenzy, then mortgage rates doubled. Now, the story is different, with the income needed to afford a home consistently dropping since October 2025. But the declines have been small, and the income required to afford a home is still $22,197 higher than the typical U.S. household income of $87,599.
Still, the gap between the income required to buy a home and actual incomes is shrinking. One year ago, the typical American household earned $26,125 less than they needed to afford the median-priced home–and two years ago, the gap was $28,834. That’s because incomes are growing a bit faster than housing costs.
“The earnings needed to buy a house have stabilized after several years of deterioration, but that doesn’t mean homes are affordable to the average American,” said Redfin Senior Economist Yingqi Xu. “There’s still a double-digit gap between what the typical household earns and what they need to comfortably buy a home, leaving many prospective first-time buyers stalled on the sidelines. But even if the market isn’t becoming much more affordable, it is becoming a bit more manageable for house hunters. It’s a buyer’s market in most of the country, especially places that were once pandemic homebuying hotspots like Nashville and Austin, giving buyers lots of options to choose from and strong negotiating power.”
Redfin economists say housing affordability could improve slightly more by the end of the year. But affordability could also worsen, especially if the Fed needs to hike interest rates more than projected, oil prices jump even more than they already have, or the AI boom intensifies the recent increase in inflation.
The affordability story is a bit brighter for starter homes: Americans need to earn $70,693 to afford the typical U.S. entry-level home, down 1.5% from a year ago. Please see this separate report for more on starter-home affordability.
Housing Costs Are Taking Up a Smaller Share of Buyers’ Budgets
The typical American homebuyer would need to spend 37.6% of their income to buy the median-priced U.S. home, down from 39.3% a year earlier. While the income required to purchase a home hasn’t budged, the median annual income has increased–from $84,257 to $87,599–pushing down the portion spent on housing.
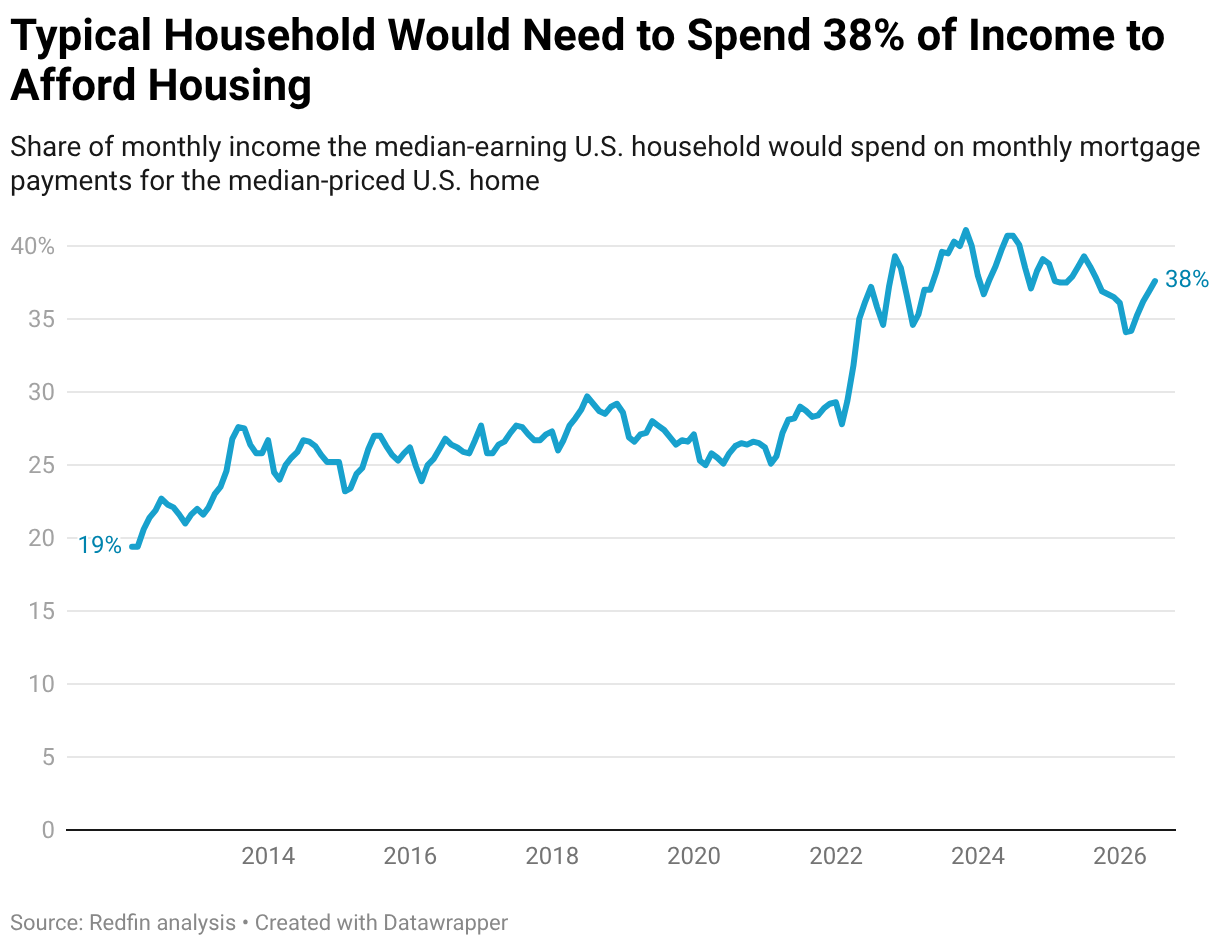
While a common rule of thumb in housing is that you should spend no more than 30% of your income on your monthly housing payment, that isn’t realistic for everyone. In the more expensive parts of the country, middle-income families would have a hard time spending just 30% of their earnings on housing.
34% of Home Listings Are Affordable, Up From 31% Last Year
The share of home listings that are affordable–i.e. they would require no more than 30% of income spent on housing–has increased over the last year.
Just over one-third (34.2%) of U.S. home listings were affordable to someone earning the median income in June, up from 30.5% a year earlier.
Still, there are far fewer affordable home listings than there used to be. Before mortgage rates shot up in 2022, more than half of U.S. home listings were affordable to the typical American nearly every single month in records dating back through 2013.
Homebuying Is Getting More Affordable on the West Coast–But It’s Still Too Expensive For the Average Local
Homebuying affordability is improving in 24 of the 46 U.S. metro areas included in this analysis
In Seattle, homebuyers needed to earn $221,831 to afford the median-priced home in June, down 7.4% year over year–the biggest decline of all the metros. That’s because prices are falling more in Seattle than anywhere else in the nation.
San Jose, CA had the second-biggest decline: Buyers there must earn $423,840, down 6.5% year over year. Portland, OR, where buyers must earn $153,844, down 4.5%, rounds out the top three. While those places are more affordable than a year ago, the income needed to buy a home is still much higher than local salaries. In San Jose, for instance, the median income of $176,401 is about $250,000 less than what’s required to afford the typical home.
There are just three major metro areas where the typical household earns more than what’s required to afford a home: St. Louis, Indianapolis and Pittsburgh.
Homebuying Is Getting Less Affordable in the Country’s Hot Markets
Pittsburgh homebuyers needed an income of $82,816 to afford the median-priced local home in June, up 6.3% year over year–the biggest increase of the metros Redfin analyzed. Next comes San Francisco, where residents must earn $453,205, more than anywhere else in the country and up 6.2%.
The next biggest increase was in West Palm Beach, FL (5.6% to $146,404). Pittsburgh, San Francisco and West Palm Beach saw home prices rise more than any other major metro in June. San Francisco is also one of just seven seller’s markets in the country, largely because demand is soaring due to the AI boom.
| Metro-Level Summary: Income Needed to Afford a Home, June 2026
We analyzed the 50 most populous U.S. CSBAs and included the 46 with sufficient data |
|||||
| U.S. metro area | Income required to afford typical home | Income required to afford typical home, YoY change | Estimated median income | Share of income required to afford a home | Share of listings affordable to median-earning household |
| Anaheim, CA | $329,849 | -0.3% | $126,178 | 78.4% | 6.1% |
| Austin, TX | $132,570 | -2.1% | $109,059 | 36.5% | 33.4% |
| Baltimore, MD | $121,298 | 1.7% | $112,328 | 32.4% | 53.1% |
| Boston, MA | $216,995 | -2.8% | $127,467 | 51.1% | 11.6% |
| Charlotte, NC | $111,862 | -1.9% | $91,545 | 36.7% | 32.9% |
| Cincinnati, OH | $90,205 | 0.1% | $89,002 | 30.4% | 45.8% |
| Cleveland, OH | $81,436 | 1.2% | $78,519 | 31.1% | 51.6% |
| Columbus, OH | $104,335 | -2.8% | $91,468 | 34.2% | 39.1% |
| Dallas, TX | $118,898 | -4.0% | $103,144 | 34.6% | 32.8% |
| Denver, CO | $157,099 | -2.4% | $116,323 | 40.5% | 29.0% |
| Detroit, MI | $66,999 | 4.0% | $65,687 | 30.6% | 62.6% |
| Fort Worth, TX | $106,708 | -0.3% | $93,102 | 34.4% | 31.7% |
| Houston, TX | $99,950 | -2.3% | $90,865 | 33.0% | 38.0% |
| Indianapolis, IN | $86,163 | -3.0% | $90,927 | 28.4% | 54.7% |
| Jacksonville, FL | $104,004 | 2.8% | $88,715 | 35.2% | 38.6% |
| Kansas City, MO | $99,646 | -1.6% | $92,718 | 32.2% | 42.9% |
| Las Vegas, NV | $116,563 | -2.0% | $82,975 | 42.1% | 18.5% |
| Los Angeles, CA | $248,586 | -2.9% | $97,775 | 76.3% | 2.6% |
| Miami, FL | $152,135 | -2.5% | $77,854 | 58.6% | 17.4% |
| Milwaukee, WI | $108,589 | 1.2% | $86,909 | 37.5% | 36.2% |
| Montgomery County, PA | $155,220 | 0.8% | $127,721 | 36.5% | 33.6% |
| Nashville, TN | $128,119 | -0.1% | $96,448 | 39.9% | 23.7% |
| Nassau County, NY | $226,406 | 2.2% | $149,811 | 45.3% | 11.8% |
| New Brunswick, NJ | $179,162 | 2.3% | $122,960 | 43.7% | 23.8% |
| New York, NY | $233,189 | 0.2% | $98,287 | 71.2% | 12.1% |
| Newark, NJ | $207,251 | 2.3% | $113,773 | 54.6% | 17.8% |
| Oakland, CA | $262,846 | -1.0% | $139,407 | 56.6% | 16.7% |
| Orlando, FL | $109,324 | -2.1% | $85,400 | 38.4% | 27.5% |
| Philadelphia, PA | $94,033 | 4.5% | $75,254 | 37.5% | 46.2% |
| Phoenix, AZ | $118,462 | -2.0% | $95,979 | 37.0% | 26.0% |
| Pittsburgh, PA | $82,816 | 6.3% | $83,419 | 29.8% | 55.9% |
| Portland, OR | $153,844 | -4.5% | $105,952 | 43.6% | 17.0% |
| Providence, RI | $150,562 | 1.5% | $94,620 | 47.7% | 9.3% |
| Riverside, CA | $155,403 | -3.8% | $97,116 | 48.0% | 12.7% |
| Sacramento, CA | $159,341 | -3.0% | $105,873 | 45.2% | 11.7% |
| San Antonio, TX | $95,256 | 0.3% | $83,650 | 34.2% | 39.2% |
| San Diego, CA | $250,097 | 1.0% | $115,304 | 65.1% | 7.4% |
| San Francisco, CA | $453,205 | 6.2% | $162,118 | 83.9% | 9.6% |
| San Jose, CA | $423,840 | -6.5% | $176,401 | 72.1% | 10.5% |
| Seattle, WA | $221,831 | -7.4% | $131,404 | 50.6% | 15.3% |
| St. Louis, MO | $86,410 | 2.9% | $88,593 | 29.3% | 56.9% |
| Tampa, FL | $103,549 | 0.2% | $81,390 | 38.2% | 30.6% |
| United States | $109,796 | -0.5% | $87,599 | 37.6% | 34.2% |
| Virginia Beach, VA | $106,920 | 2.4% | $91,854 | 34.9% | 33.7% |
| Warren, MI | $97,121 | 1.6% | $96,676 | 30.1% | 47.0% |
| Washington, DC | $170,363 | -0.1% | $141,029 | 36.2% | 41.9% |
| West Palm Beach, FL | $146,404 | 5.6% | $90,688 | 48.4% | 33.4% |