cBridge launches Markout Report to help brokers detect toxic flow before it hits P&L
cBridge has introduced Markout Report, a new risk intelligence module that helps brokers detect potentially toxic flow, assess its financial impact and respond before repeated losses accumulate.
The challenge many brokers face is catching toxic flow early enough – picking out the harmful trading patterns and turning them into consistent routing decisions. Markout Report addresses this: it brings execution records and raw tick data into continuous, account-level risk intelligence, updated throughout the day. As a result, brokers can identify adverse patterns earlier in the trading session and respond before their financial impact grows.

Here’s how it works: the system flags the accounts that need attention and shows straight away why they were flagged. The trading department can then investigate further – checking the instruments and trading behaviour involved, exporting data if needed and applying the right routing treatment – all within the same cBridge workflow, without switching tools or passing data between systems.
Catching risk at the point it develops

Most teams review execution quality only after the session, once the P&L has already settled. By that point, the loss is fixed – the only option left is to record it and adjust routing going forward.
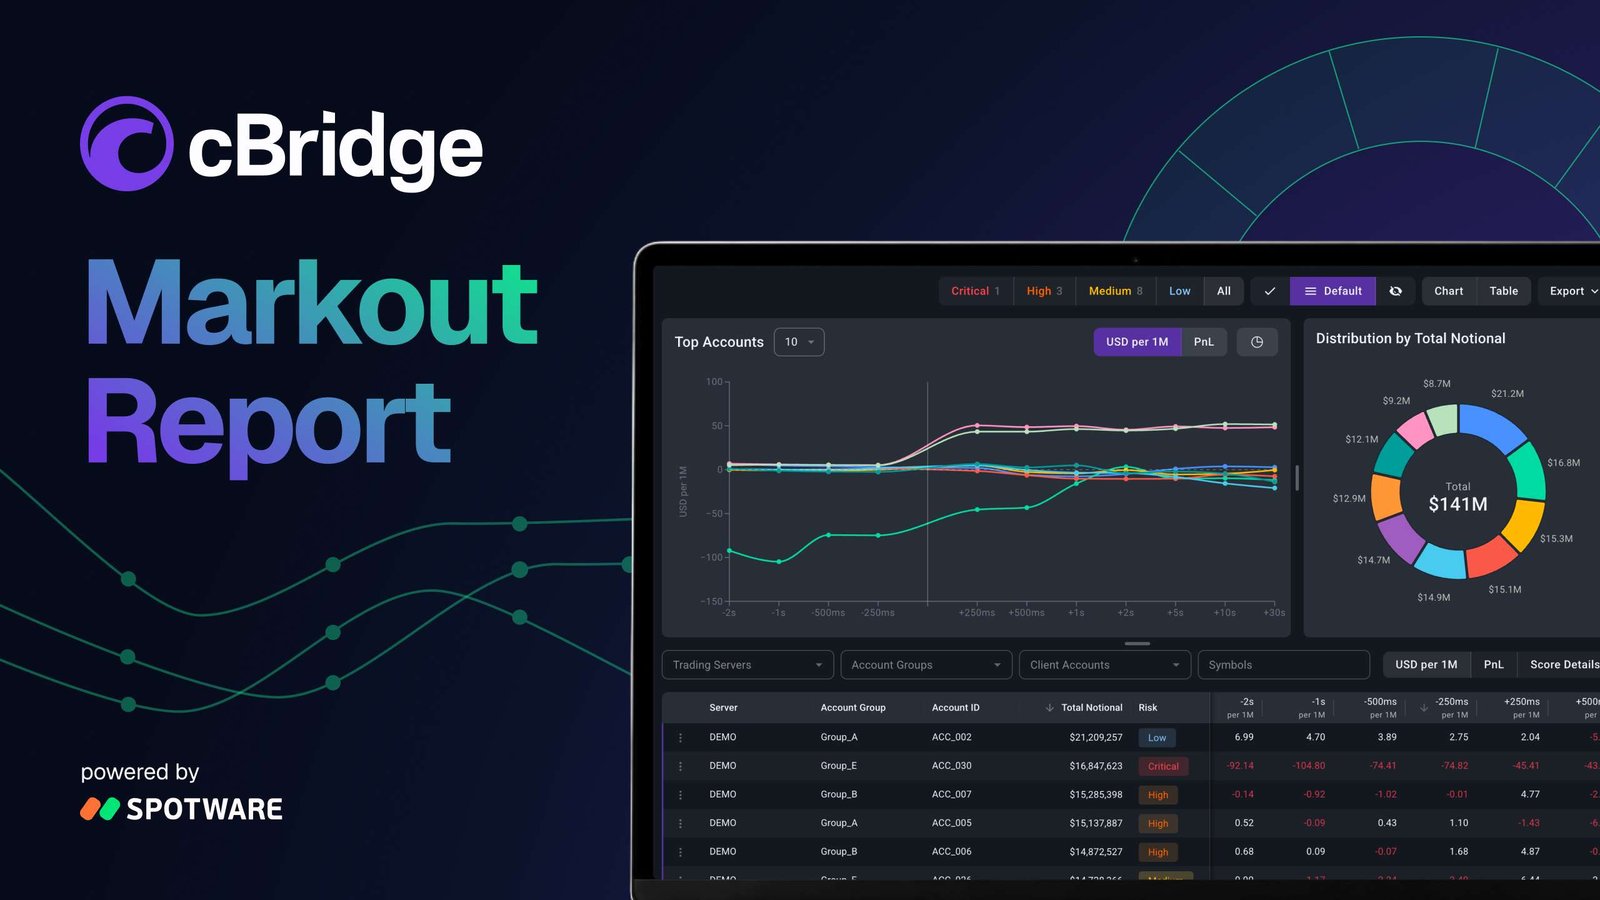
Markout Report instead measures markout and pre-trade drift continuously, while the session is still running. Risk teams can watch how accounts are behaving in real time, including during volatile periods. Interactive charts visualise account-level markout metrics across configurable time intervals, helping trading teams identify recurring patterns and investigate potentially adverse flow without manually reconstructing individual trades.
As a result, earlier visibility gives trading departments more time to respond before repeated losses accumulate.
Prioritising accounts by financial impact

Some unusual accounts cause only minor losses, while others can create significant leakage. Markout Report ranks accounts by both risk and notional volume, so the trading department knows where to focus: the “Top accounts” view highlights which ones have the biggest impact, while the notional distribution shows how trading volume is concentrated across the account base. This reduces time spent on low-value analysis and directs attention to the accounts where timely action can meaningfully protect the broker’s P&L.
Account behaviour is classified at low, medium, high and critical risk levels, based on four transparent signals: markout, pre-trade drift, decay and consistency. Brokers can see exactly why an account was flagged. Every account is judged against the same framework, not individual interpretation, so decisions stay consistent across shifts and each routing action can be traced back to the specific signals that drove it.
One interface for the full workflow

Once a potentially harmful account is identified, the next step – finding what’s actually driving the result – is usually the most time-consuming part.
Markout Report keeps this process in one interface. Teams can scope the analysis to the relevant part of the account base, use filters to isolate specific conditions and drill down to see whether the behaviour is concentrated in one instrument or repeated across several. Accounts can be categorised to keep the investigation structured, and pinned to stay visible throughout the review.
It’s all in the same place – charts, account tables, risk summaries, investigation tools – so the trading team gets a clear conclusion about a specific account without switching between separate tools.
Once the trading department confirms that an account requires intervention, the relevant routing action can be initiated within the cBridge environment.
Keeping the full workflow together reduces response time and lowers the operational risk created by copy-pasting data, moving between platforms and relying on informal handovers.
Markout Report reflects the broader direction of cBridge. We want risk management to be a core part of the liquidity bridge, not something brokers have to handle separately – so execution, monitoring, investigation and control all happen in one place. As brokers grow, the operational side gets harder to manage, and that’s exactly the problem we’re trying to solve: giving them room to scale without losing control over their risk
Alexis Droussiotis

Every broker already generates the execution data needed to understand its flow. The difference lies in how quickly that data becomes actionable. With continuous markout measurement, account views prioritised by financial impact, explainable risk scoring and integrated routing actions, Markout Report helps brokers move from delayed analysis to measurable control.
Request a demo to see how your execution data can be analysed within cBridge and discuss how Markout Report can support your B-Book risk workflow.
Read more to see how Markout Report brings risk detection, investigation and action in one workflow, helping brokers make earlier, more consistent decisions and reduce financial leakage.
cBridge by Spotware is a standalone liquidity bridge for FX/CFD brokers. The platform-agnostic solution connects MT4, MT5, cTrader and FIX API trading platforms to multiple liquidity providers. cBridge offers real-time price aggregation, flexible order routing, risk management controls, exposure monitoring, execution management and reporting. Its modular architecture helps brokers scale as trading volumes grow and allows individual components to be maintained without interrupting live trading. cBridge uses an infrastructure-based pricing model, helping brokerages keep bridge costs independent from trading volume.
The post cBridge launches Markout Report to help brokers detect toxic flow before it hits P&L first appeared on LeapRate | Online Trading Industry News, Broker Intelligence & Fintech Analysis.