How return comparisons can mislead investors: Focused mutual funds hold just 30 stocks but benchmark against Nifty 500
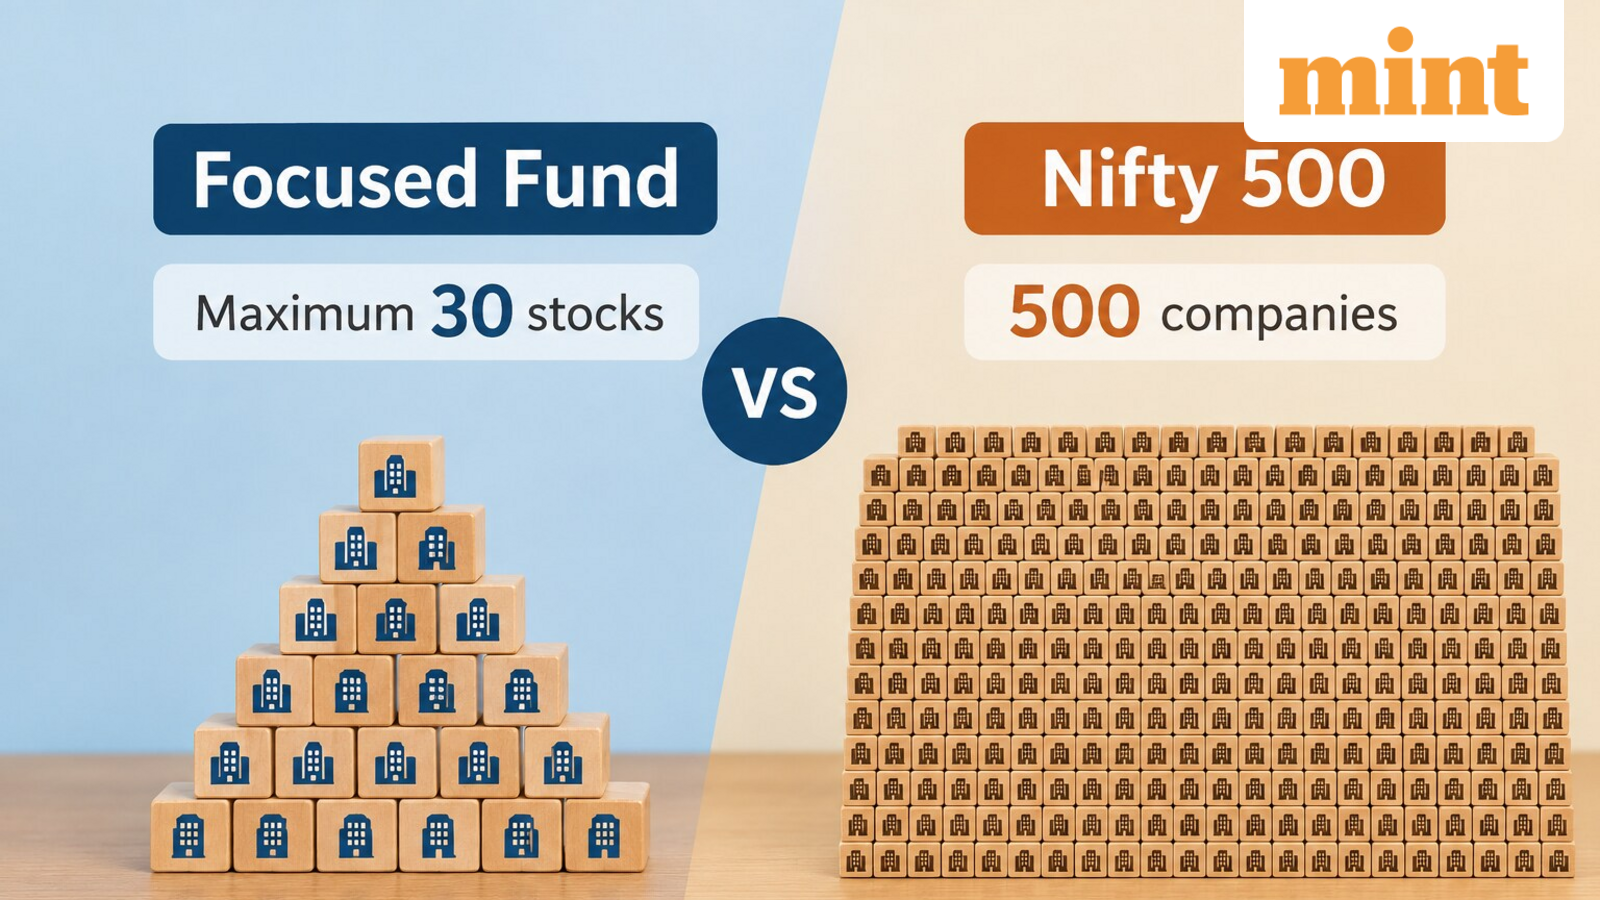
Focused mutual funds are equity schemes that can invest in a maximum of 30 stocks, with at least 65% of their assets in equities. They can invest across market capitalisations, including large-cap, mid-cap and small-cap stocks.
Every active mutual fund scheme has a benchmark against which investors compare its performance. Focused funds generally use the Nifty 500 TRI or BSE 500 TRI as their benchmark. TRI stands for Total Return Index, which accounts for both price changes and reinvested dividends.
This means investors are comparing a portfolio of up to 30 stocks with the returns of an index representing 500 companies.
According to AMFI data, as of October 22, 2026, SBI Focused Fund, the largest scheme in the category by assets under management (AUM), delivered a 1-year return of 4.02%, while its benchmark (BSE 500 TRI) fell 7.95%.
The next big fund in this category, HDFC Focused Fund, fell 6.56%, while the Nifty 500 TRI declined 7.64%. Here’s why focused funds use broad-market benchmarks and whether the industry needs a better approach.
Why are focused funds benchmarked against the Nifty 500?
Jyoti Bhandari Chandra, Founder of Lovak Capital, said focused funds use the Nifty 500 TRI or BSE 500 TRI because of the category’s investment mandate. Under SEBI’s uniform benchmark framework, AMFI assigns a Tier 1 benchmark to each category. Since focused funds can invest across market capitalisations and investment styles, Nifty 500 offers a common benchmark.
Bruce Keith, Co-founder & CEO, InvestorAi, said the Nifty 500 is appropriate because it represents the universe from which these funds can select stocks. At a more practical level, investors have the opportunity to analyse these concentrated funds’ performance and check whether they are outperforming the index.
Harsha Vardhana VM, Founder-Group CEO, Atom Financial Services, said narrower benchmarks could create their own distortions. Comparing a fund holding mid-cap stocks with the Nifty 50 could make those holdings appear to be bets against the index. A broad benchmark provides a consistent yardstick across the category.
However, the index represents the wider market, while a focused fund holds only a small selection of stocks. A portfolio of 26 holdings may have an active share well above 70%, meaning its holdings and weights differ substantially from the index. It shows whether the fee was worth paying, but it says nothing about how the manager got the result, he added.
What would be a more appropriate benchmark for focused funds?
Manish P. Hingar, Chartered Accountant, Founder and Chief Executive Officer, Fintoo said, “There’s no perfect answer. The Nifty 50 is too narrow for many of these funds, since a lot of them own mid and small caps, so comparing them with 50 large companies isn’t fair either. A fully customised benchmark has its own problem: make it too specific, and you can’t compare the fund with anything.”
A sounder approach is an industry-standard second benchmark that mirrors each fund’s actual market cap mix, kept alongside the Tier 1 index. Hybrid funds already operate this way, using composite benchmarks that reflect asset allocation, Chandra added.
Vardhana VM said the more accurate approach is a composite benchmark built from the fund’s own history. If a scheme has held about 70% large caps and 30% mid caps over time, a blend of 70% Nifty 100 TRI and 30% Nifty Midcap 150 TRI would test the manager against the exposure actually taken.
How should investors analyse focused funds?
Vardhana VM said investors should look at two numbers: how the fund performed against the broader market (Nifty 500) and how it performed against its own style (large-, mid-, or small-cap indices). The difference between these two numbers is itself useful information.
For a fund that is largely a large-cap portfolio, the Nifty 100 TRI is often the closer comparison. So, investors can run that check themselves using factsheet data, he added.
Keith said investors should focus on consistency and repeatable alpha (monthly relative performance) in focused funds.
Vardhana VM suggested that focused funds can be analyzed using these measures:
- Downside capture: Downside capture shows how the fund held up when markets fell. Below 100% across market corrections indicates the fund fell less than its benchmark.
- Information ratio: A reading above 0.5 sustained over several years may indicate consistent performance and that the fund manager is skilled.
- Turnover and cash levels: High turnover or large cash holdings may suggest returns came from market timing rather than stock selection.
- Performance period and benchmarks: Assess returns over at least three years against both the Nifty 500 TRI and Nifty 100 TRI. Outperformance against both across multiple periods may indicate stronger stock selection.
Hingar suggested a clear step-by-step process:
- Look at rolling returns over three and five years and compare them with the benchmark.
- Check alpha, information ratio, and downside capture ratio.
- Examine the portfolio. Check whether outperformance comes from one sector call or a large-cap, small-cap, or mid-cap tilt, rather than stock selection.
Disclaimer: This story is for educational purposes only. The views and recommendations made above are those of individual analysts or broking companies, and not of Mint. We advise investors to check with certified experts before making any investment decisions.
About the Author
Sheetal Goel is a Content Producer at Livemint, where she covers corporate developments, personal finance, business trends, markets, and SEBI-related updates. She focuses on simplifying complex financial concepts and presenting them in a clear, reader-friendly manner, thereby helping audiences better understand investment trends, personal finance, and market developments. Her writing focuses on making finance more accessible to everyday readers while maintaining clarity, accuracy, and relevance.
She holds a degree in Economics (Hons.) along with an MBA in Finance, which has helped her develop a strong foundation in financial analysis, market understanding, and business reporting. Before joining journalism, she worked with finance and broking firms, where she closely followed market developments, investment strategies, and evolving industry trends. This practical exposure strengthened her understanding of financial markets. She has also written content across multiple formats and platforms, including YouTube, LinkedIn, and Instagram.
Over time, she has developed expertise in covering market-linked stories, investor-focused topics, and regulatory updates in a simplified yet informative style. She also enjoys reading and listening to Hindi poetry, reflecting her appreciation for literature and creative expression beyond the world of markets and numbers.