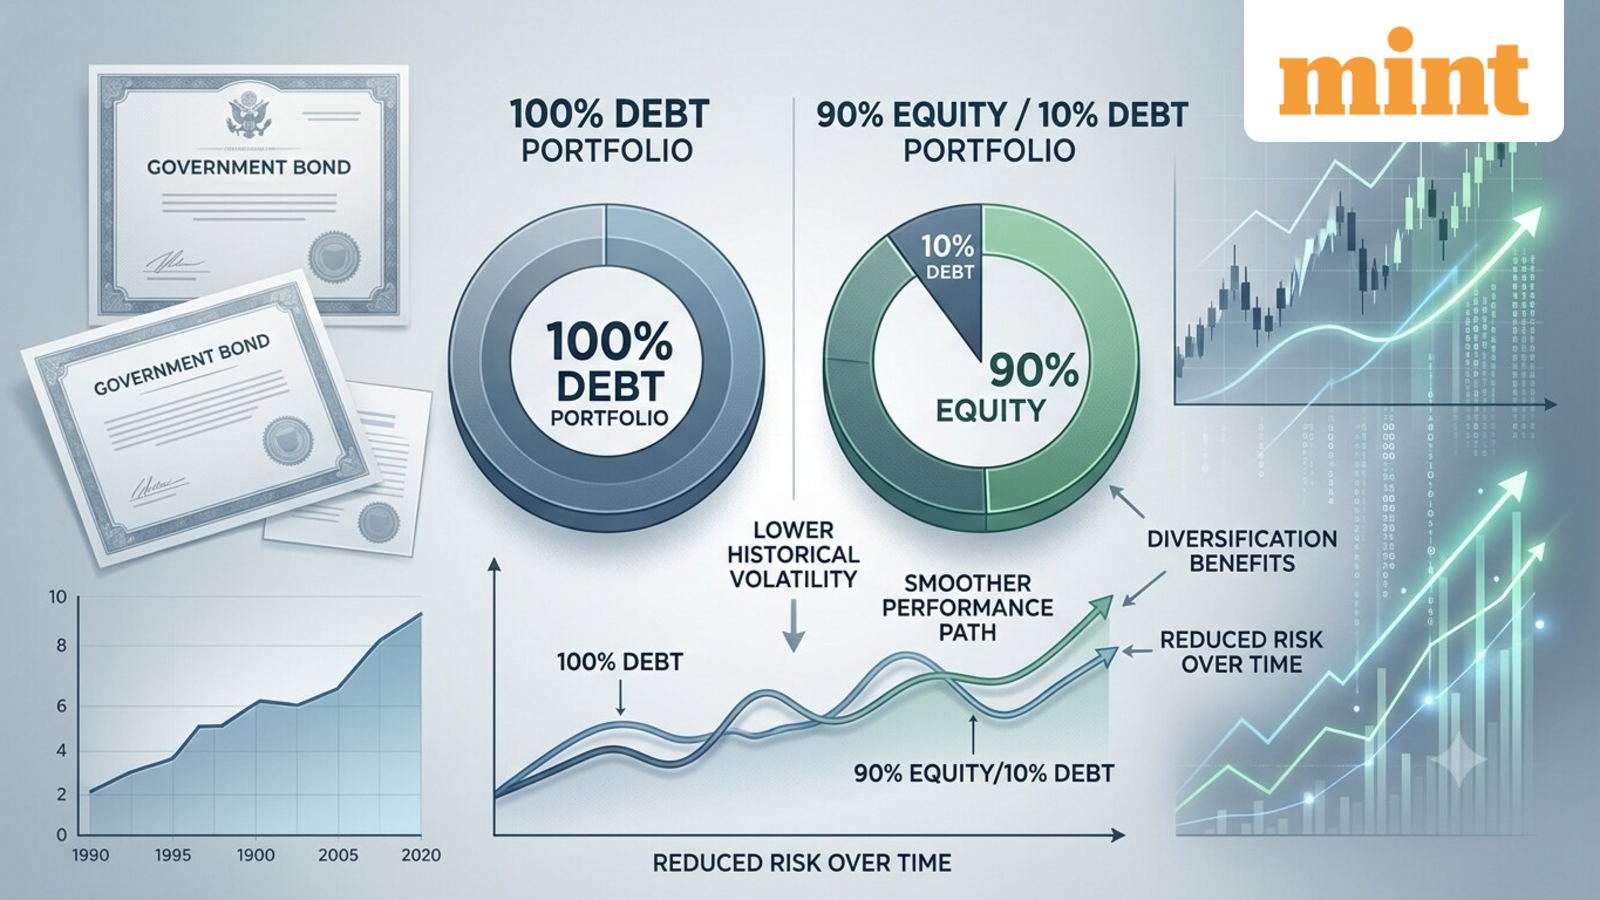
Think 100% debt portfolio is the safest? 25-year study reveals how adding equity mutual funds could reduce risk
Investors often assume that a 100% debt portfolio minimises risk and volatility. However, that may not always be the case. A 25-year study reveals how adding equity funds could reduce portfolio volatility while improving average returns.
WhiteOak Capital Mutual Fund’s latest “Chemistry of Investing” study examines how different combinations of debt and equity have historically influenced portfolio risk and return outcomes. Here’s what you need to know.
How do returns and risk differ across debt and equity portfolios?
The study compares portfolios with different allocations to debt and equity, using the CRISIL 10 Year Gilt Index for debt and the BSE Sensex TRI for equity. It considers average one-year rolling returns and standard deviation (volatility) for various debt-equity combinations over 25 years, from September 2001 to September 2026.
Rolling returns measure returns over a fixed period, such as one year, across multiple overlapping start dates. Instead of relying on a single investment date, they show how a portfolio performed across different market conditions. Volatility, measured here using standard deviation, indicates how widely returns varied around their average.
| Portfolio Composition | Average Annual Return | Average Annual Volatility |
| D:100% E:0% | 6.74% | 6.36% |
| D:90% E:10% | 7.93% | 5.77% |
| D:80% E:20% | 9.11% | 6.40% |
| D:75% E:25% | 9.70% | 7.10% |
| D:70% E:30% | 10.29% | 7.98% |
| D:60% E:40% | 11.48% | 10.07% |
| D:50% E:50% | 12.66% | 12.41% |
| D:40% E:60% | 13.84% | 14.89% |
| D:30% E:70% | 15.03% | 17.44% |
| D:20% E:80% | 16.21% | 20.05% |
| D:10% E:90% | 17.39% | 22.68% |
| D:0% E:100% | 18.58% | 25.34% |
Source: WhiteOak Capital Mutual Fund; D = Debt (Crisil 10 Year Gilt Index), E = Equity (BSE Sensex TRI); The study considers average one-year rolling returns and standard deviation from September 2001 to September 2026.
The study shows that a portfolio comprising 90% debt and 10% equity recorded average annual volatility of 5.77%, compared with 6.36% for a 100% debt portfolio. Its average annual return was also higher at 7.93%, compared with 6.74% for the all-debt portfolio.
Similarly, an 80% debt and 20% equity portfolio recorded average volatility of 6.40%, broadly comparable to the all-debt portfolio, while delivering an average annual return of 9.11%. This is 2.37 percentage points higher than the all-debt portfolio’s average return.
As the equity allocation increases, both average returns and volatility generally rise. For instance, a portfolio with a 50% debt and 50% equity allocation recorded an average annual return of 12.66% and volatility of 12.41%.
A 100% equity portfolio recorded the highest average annual return of 18.58%, but also the highest volatility of 25.34%.
What should mutual fund investors consider?
The findings highlight the role of asset allocation in balancing potential returns and portfolio volatility. Adding a limited equity allocation to a debt portfolio is associated with lower historical volatility and higher average returns. However, this does not mean that adding equity will always reduce risk or that the same outcomes will be repeated.
Mutual fund investors should assess their asset allocation based on their financial goals, investment horizon, and risk tolerance rather than assuming that a 100% debt portfolio is necessarily the safest option.
Disclaimer: This is for informational purposes only and does not constitute investment advice. Please consult a SEBI-registered investment advisor.