U.S. Foreclosure Rates by State – May 2026
What Is the Current Foreclosure Rate in the U.S.?
In June 2026, U.S. foreclosure activity declined from the prior month but remained higher than levels reported one year earlier, continuing to reflect movement above last year’s pace.
Total filings: 39,327 properties with default notices, scheduled auctions, or bank repossessions
Monthly change: Down 3 percent from May 2026
Year-over-year change: Up 21 percent from June 2025
National rate: One in every 3,656 housing units had a foreclosure filing
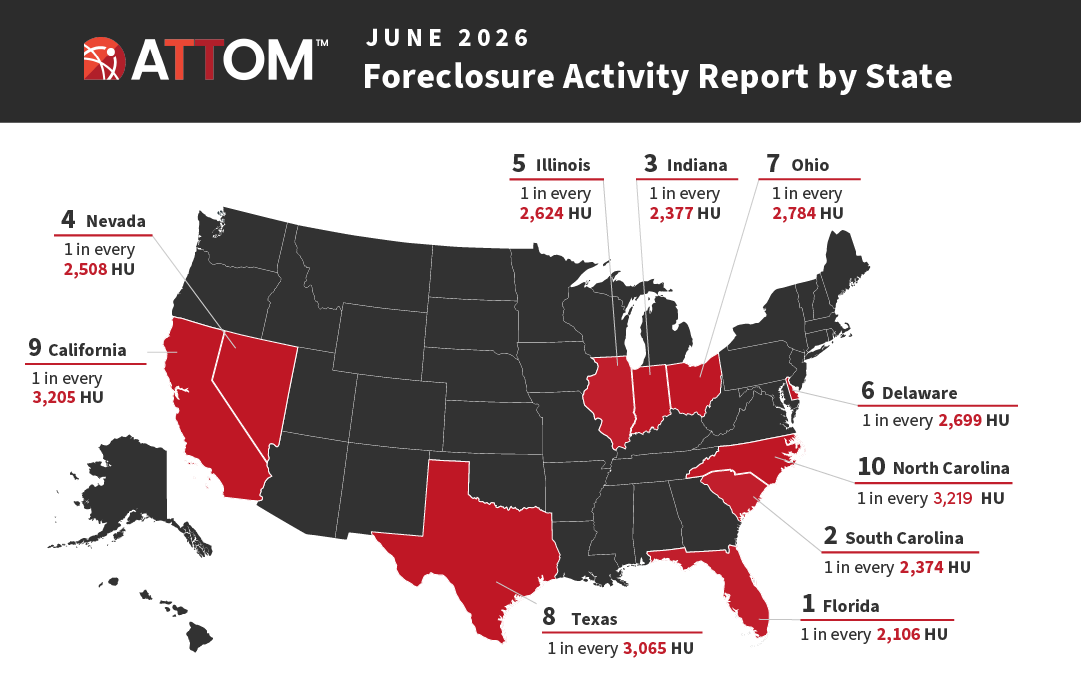
States with the worst foreclosure rates: Florida, South Carolina, Indiana, Nevada, Illinois
Foreclosure Starts and Completions
Starts: Lenders initiated the foreclosure process on 26,217 U.S. properties in June 2026, down 4 percent from the previous month but up 20 percent from a year ago.
Completions (REOs): Lenders repossessed 4,773 properties in June 2026, up 17 percent from the previous month and up 23 percent from a year ago.
What’s Driving June 2026 Foreclosure Trends?
Foreclosure activity in June 2026 decreased month over month but remained above year-ago levels. The monthly decline was reflected in fewer foreclosure starts, while completed foreclosures increased from May. On an annual basis, total filings, starts, and completed foreclosures were all higher than in June 2025, pointing to continued elevated foreclosure activity compared with last year as the market normalizes.
Foreclosure Rates by State – June 2026
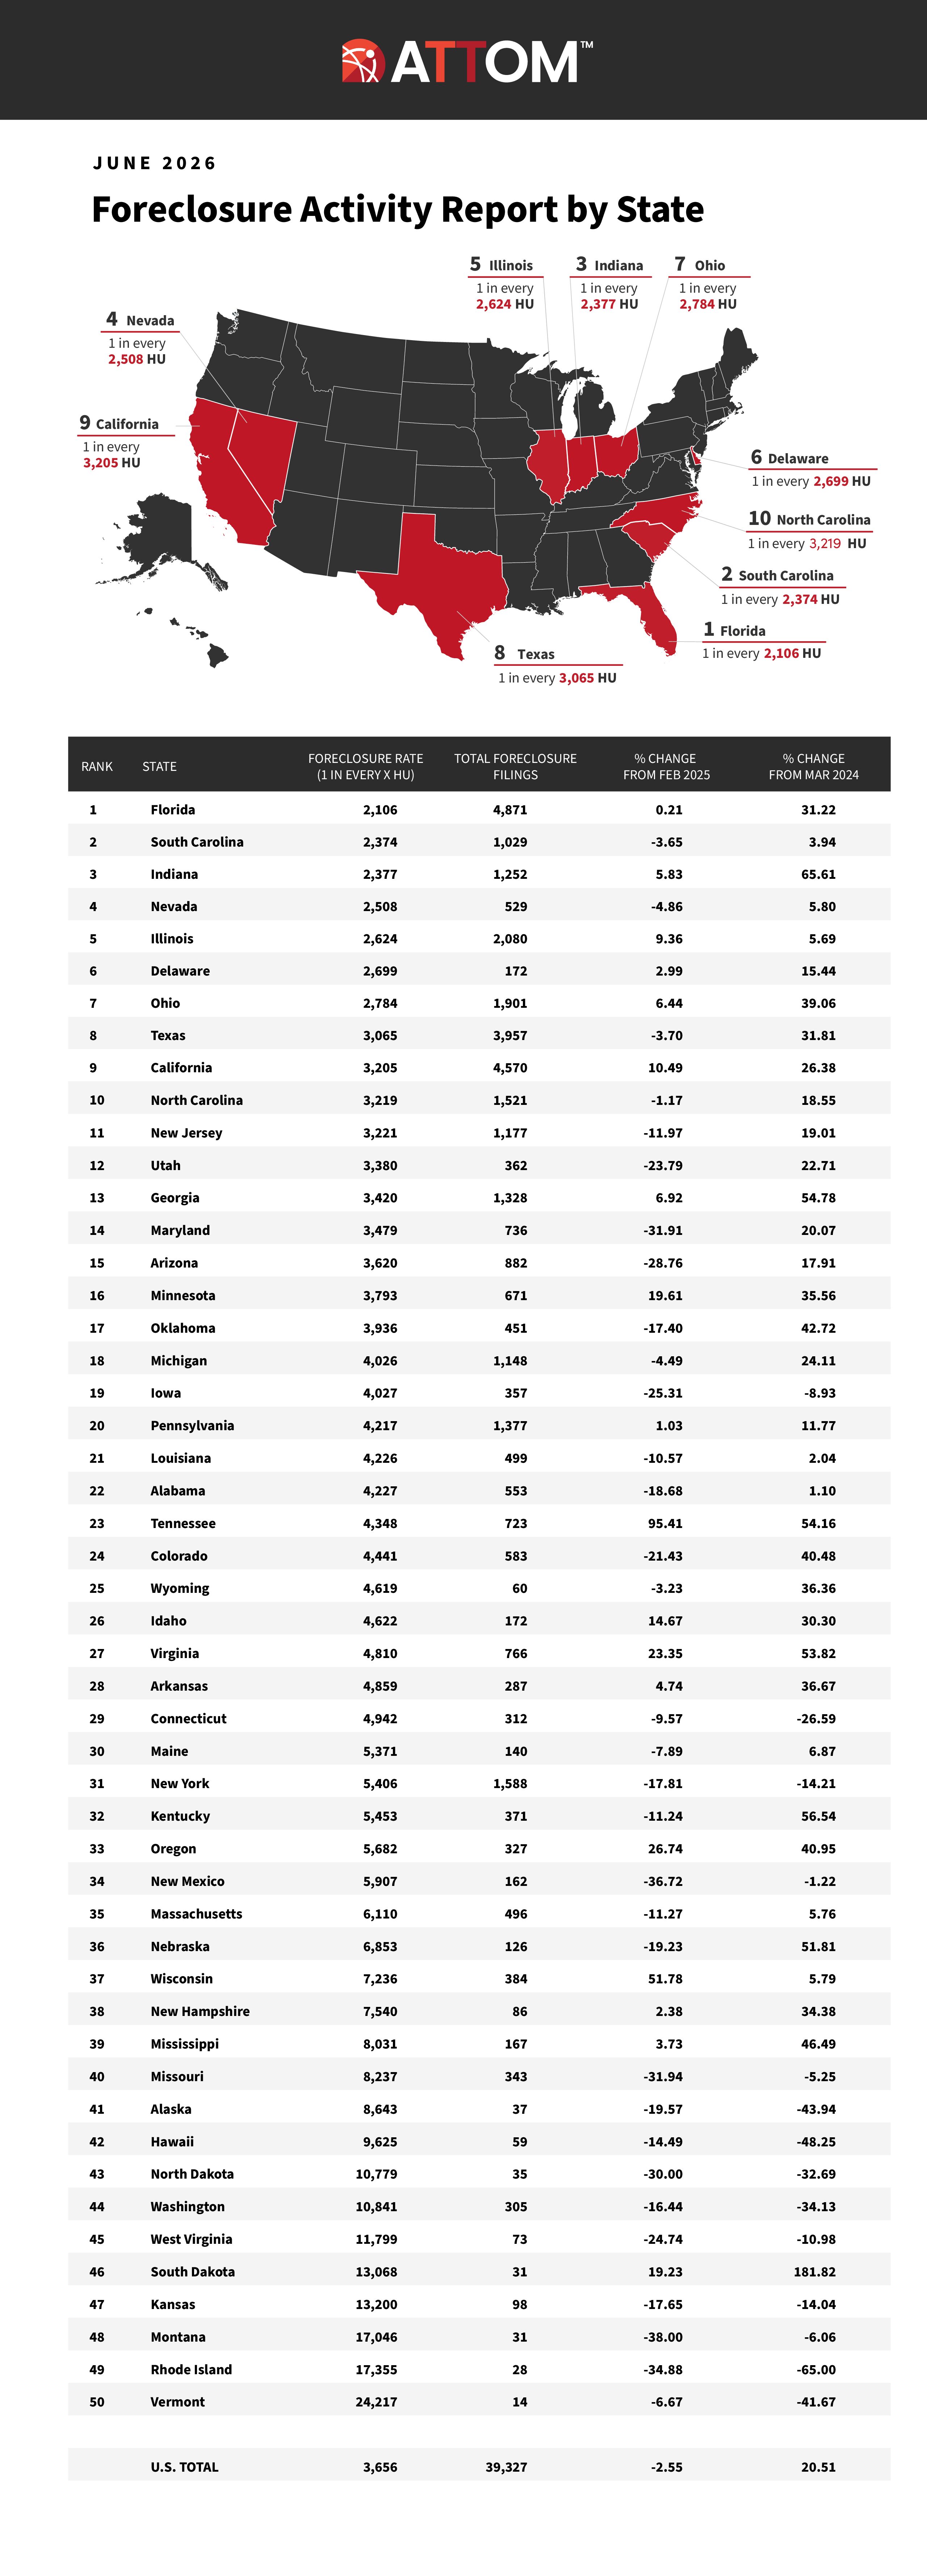
Below is the complete state-by-state foreclosure ranking for June 2026 and the top 4 counties with the worst foreclosure rates per state.
1. Florida
1 in every 2,106 housing units (4,871 filings / 10,256,470 units)
Counties: Charlotte, Polk, Okeechobee, Osceola
2. South Carolina
1 in every 2,374 housing units (1,029 filings / 2,443,039 units)
Counties: Lexington, Dorchester, Kershaw, Richland
3. Indiana
1 in every 2,377 housing units (1,252 filings / 2,976,568 units)
Counties: Clinton, Madison, Noble, Morgan
4. Nevada
1 in every 2,508 housing units (529 filings / 1,326,471 units)
Counties: Mineral, Clark, Lyon, Lincoln
5. Illinois
1 in every 2,624 housing units (2,080 filings / 5,457,452 units)
Counties: Macoupin, Mcdonough, Whiteside, Kendall
6. Delaware
1 in every 2,699 housing units (172 filings / 464,203 units)
Counties: New Castle, Kent, Sussex
7. Ohio
1 in every 2,784 housing units (1,901 filings / 5,292,391 units)
Counties: Fayette, Putnam, Seneca, Fulton
8. Texas
1 in every 3,065 housing units (3,957 filings / 12,128,515 units)
Counties: Liberty, Kaufman, Caldwell, Ector
9. California
1 in every 3,205 housing units (4,570 filings / 14,644,735 units)
Counties: Lake, Shasta, Sutter, Mendocino
10. North Carolina
1 in every 3,219 housing units (1,521 filings / 4,895,668 units)
Counties: Gaston, Cleveland, Pasquotank, Bladen
11. New Jersey
1 in every 3,221 housing units (1,177 filings / 3,791,354 units)
Counties: Salem, Cumberland, Camden, Sussex
12. Utah
1 in every 3,380 housing units (362 filings / 1,223,468 units)
Counties: Garfield, Carbon, Box Elder, Duchesne
13. Georgia
1 in every 3,420 housing units (1,328 filings / 4,541,835 units)
Counties: Effingham, Berrien, Jasper, Bryan
14. Maryland
1 in every 3,479 housing units (736 filings / 2,560,784 units)
Counties: Baltimore City, Charles, Kent, Allegany
15. Arizona
1 in every 3,620 housing units (882 filings / 3,192,839 units)
Counties: Pinal, Greenlee, La Paz, Cochise
16. Minnesota
1 in every 3,793 housing units (671 filings / 2,545,030 units)
Counties: Renville, Cottonwood, Dodge, Chisago
17. Oklahoma
1 in every 3,936 housing units (451 filings / 1,775,127 units)
Counties: Beaver, Harper, Woodward, Canadian
18. Michigan
1 in every 4,026 housing units (1,148 filings / 4,622,236 units)
Counties: Gratiot, Montmorency, Saint Joseph, Macomb
19. Iowa
1 in every 4,027 housing units (357 filings / 1,437,699 units)
Counties: Fremont, Obrien, Grundy, Greene
20. Pennsylvania
1 in every 4,217 housing units (1,377 filings / 5,806,452 units)
Counties: Philadelphia, Crawford, Delaware, Allegheny
21. Louisiana
1 in every 4,226 housing units (499 filings / 2,108,902 units)
Counties: Beauregard, Livingston, Tangipahoa, Ascension
22. Alabama
1 in every 4,227 housing units (553 filings / 2,337,265 units)
Counties: Geneva, Saint Clair, Dale, Cleburne
23. Tennessee
1 in every 4,348 housing units (723 filings / 3,143,670 units)
Counties: Decatur, Carroll, Scott, Houston
24. Colorado
1 in every 4,441 housing units (583 filings / 2,589,053 units)
Counties: Washington, Pueblo, Logan, Lincoln
25. Wyoming
1 in every 4,619 housing units (60 filings / 277,141 units)
Counties: Goshen, Washakie, Carbon, Campbell
26. Idaho
1 in every 4,622 housing units (172 filings / 795,014 units)
Counties: Bingham, Bonneville, Lemhi, Owyhee
27. Virginia
1 in every 4,810 housing units (766 filings / 3,684,756 units)
Counties: Franklin City, Martinsville City, Lexington City, Southampton
28. Arkansas
1 in every 4,859 housing units (287 filings / 1,394,673 units)
Counties: Randolph, Yell, Johnson, Boone
29. Connecticut
1 in every 4,942 housing units (312 filings / 1,541,822 units)
Counties: South Central Connecticut, Northeastern Connecticut, Naugatuck Valley, Northwest Hills
30. Maine
1 in every 5,371 housing units (140 filings / 751,876 units)
Counties: Aroostook, Kennebec, Waldo, Penobscot
31. New York
1 in every 5,406 housing units (1,588 filings / 8,585,241 units)
Counties: Orange, Oswego, Livingston, Nassau
32. Kentucky
1 in every 5,453 housing units (371 filings / 2,023,116 units)
Counties: Bath, Butler, Jefferson, Lincoln
33. Oregon
1 in every 5,682 housing units (327 filings / 1,857,992 units)
Counties: Columbia, Douglas, Umatilla, Crook
34. New Mexico
1 in every 5,907 housing units (162 filings / 956,964 units)
Counties: Mora, Curry, Valencia, Otero
35. Massachusetts
1 in every 6,110 housing units (496 filings / 3,030,406 units)
Counties: Franklin, Hampden, Plymouth, Worcester
36. Nebraska
1 in every 6,853 housing units (126 filings / 863,444 units)
Counties: Burt, Merrick, Jefferson, Johnson
37. Wisconsin
1 in every 7,236 housing units (384 filings / 2,778,572 units)
Counties: Rusk, Ashland, Langlade, Juneau
38. New Hampshire
1 in every 7,540 housing units (86 filings / 648,472 units)
Counties: Coos, Sullivan, Strafford, Grafton
39. Mississippi
1 in every 8,031 housing units (167 filings / 1,341,114 units)
Counties: Kemper, Copiah, Yazoo, Washington
40. Missouri
1 in every 8,237 housing units (343 filings / 2,825,287 units)
Counties: Lawrence, Shannon, Butler, Lewis
41. Alaska
1 in every 8,643 housing units (37 filings / 319,781 units)
Counties: Nome, Fairbanks North Star, Bethel, Kenai Peninsula
42. Hawaii
1 in every 9,625 housing units (59 filings / 567,896 units)
Counties: Hawaii, Honolulu, Kauai, Maui
43. North Dakota
1 in every 10,779 housing units (35 filings / 377,281 units)
Counties: Sargent, Pierce, Ransom, Mchenry
44. Washington
1 in every 10,841 housing units (305 filings / 3,306,620 units)
Counties: Okanogan, Mason, Grays Harbor, Stevens
45. West Virginia
1 in every 11,799 housing units (73 filings / 861,325 units)
Counties: Grant, Hardy, Calhoun, Fayette
46. South Dakota
1 in every 13,068 housing units (31 filings / 405,114 units)
Counties: Fall River, Butte, Mccook, Walworth
47. Kansas
1 in every 13,200 housing units (98 filings / 1,293,635 units)
Counties: Geary, Washington, Jackson, Marion
48. Montana
1 in every 17,046 housing units (31 filings / 528,419 units)
Counties: Mineral, Glacier, Richland, Silver Bow
49. Rhode Island
1 in every 17,355 housing units (28 filings / 485,932 units)
Counties: Providence, Kent, Bristol, Washington
50. Vermont
1 in every 24,217 housing units (14 filings / 339,042 units)
Counties: Orleans, Windham, Lamoille, Orange
Key Insights from June 2026 Foreclosure Market Report
Foreclosure activity in June 2026 declined compared with the previous month but remained above year-ago levels. Foreclosure starts moved lower from May while completed foreclosures increased, and both measures were higher than in June 2025. Overall activity remained elevated compared with last year, though the broader picture continued to reflect a market gradually returning to more typical patterns.
Explore ATTOM’s Foreclosure Data
ATTOM’s Foreclosure Data tracks default notices, scheduled auctions, and bank repossessions nationwide, with historical trends and county-level insights. This data empowers lenders, investors, and market analysts to monitor loan default trends, assess market risks, and uncover investment opportunities.