20 Biggest Airports in the US Ranked According to Passengers
There are large airports, and then there are “mega airports.”
The annual JD Power North America Airport Satisfaction Study measured overall passenger satisfaction at US airports across three size categories: medium (4.5 to 9.9 million passengers a year), large (10 to 32.9 million passengers a year), and mega (33 million or more passengers a year).
The 2026 study was based on 24,710 surveys of US and Canadian residents who traveled through at least one eligible North American airport in the 30 days before completing the survey. The segment average was 617 on a 1,000-point scale.
While Canadian residents were surveyed for the 2026 study, Canadian airports, including Toronto Pearson, were not included in this year’s rankings because the company changed its sampling methodology in Canada, a JD Power spokesperson told Business Insider.
For the ranking, passengers were asked to evaluate their experiences across seven core factors, in order of importance:
- Ease of travel through the airport
- Level of trust in the airport
- Terminal facilities
- Airport staff
- Departure/to airport experience
- Food, beverage, and retail
- Arrival/from airport experience
One takeaway from the 2026 study: airport renovations pay off.
The highest-ranked airports in 2026 have either recently completed or are almost finished with capital improvement projects. Though these makeovers can cost upward of $1 billion and span multiple years, the results speak for themselves — JD Power found overall passenger satisfaction at mega airports increased 14 points, even as passenger volume remains at record levels.
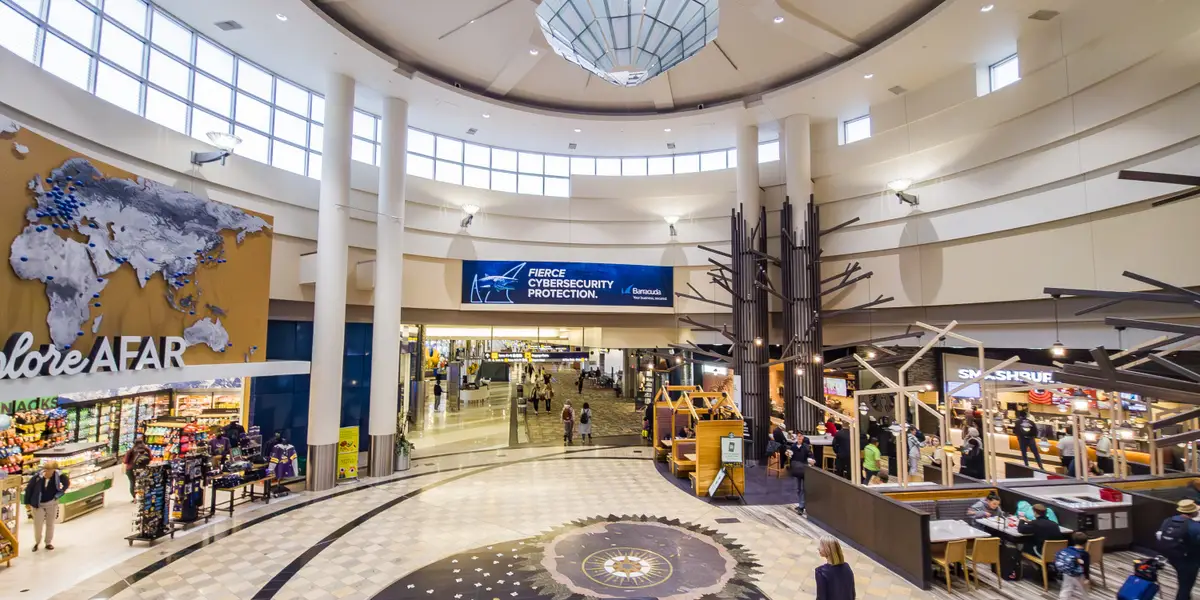
Minneapolis-St. Paul International Airport, which ranked first for the third year in a row in 2026, recently underwent a $242 million terminal renovation in December 2025, refreshing gate areas, seating, flooring, lighting, signs, and other post-security spaces.
More satisfied passengers also spend more money, JD Power found. Travelers who rated their airport experience “perfect” spent an average of $20.22 more than those who rated their airport trips “just OK.” JD Power also found that high-scoring airports have a good balance of chain and local restaurants and shops, as well as clear signage.
“For the better part of the last decade, nearly every airport, from the largest international hubs to midsized airfields, has undertaken a significant capital improvement project aimed at streamlining passenger flow, adding attractive food and beverage options, and improving overall passenger experience,” Michael Taylor, managing director of travel, hospitality, and retail at JD Power, said in a press release. “On the whole, those efforts are finally starting to pay off in the form of higher overall passenger satisfaction scores.”
Here are the best airports in North America, ranked by passengers.
20. Chicago O’Hare International Airport (tie)

aoldman/Getty Images/iStockphoto
20. New Jersey’s Newark Liberty International Airport (tie)
Mak Studio/Getty Images
18. Denver International Airport
ivanastar/Getty Images
17. Charlotte Douglas International Airport
Kaylee Greenlee/REUTERS
16. Hartsfield-Jackson Atlanta International Airport (tie)
SeanPavonePhoto/Getty Images
16. Houston’s George Bush Intercontinental Airport (tie)
hapabapa/Getty Images
14. Los Angeles International Airport
Michelle Brittain/iStock
13. Fort Lauderdale-Hollywood International Airport
Boarding1Now/iStock
12. Dallas/Fort Worth International Airport
Juan Figueroa/The Dallas Morning News via Getty Images
11. Seattle-Tacoma International Airport
Mak Studio/Getty Images
10. Orlando International Airport
Ancient Aftertone/Getty Images
9. Boston Logan International Airport
Gabriel Giannelli/Getty Images
8. New York’s John F. Kennedy International Airport
travelview/Getty Images
7. Miami International Airport
Boarding1Now/Getty Images
6. San Francisco International Airport
Nate Hovee/Getty Images
5. Las Vegas’ Harry Reid International Airport
Boarding1Now/iStock
4. New York’s LaGuardia Airport
Boarding1Now/iStock
3. Phoenix Sky Harbor International Airport
Boarding1Now/iStock
2. Detroit Metropolitan Wayne County Airport
JHVEPhoto/Getty Images
1. Minneapolis-Saint Paul International Airport
Davslens Photography/Getty Images